Benchmarking Reaction Barriers: When to Use DFT vs. Coupled-Cluster in Drug Discovery & Catalysis
This article provides a comprehensive guide for computational chemists and drug development researchers on selecting and applying Density Functional Theory (DFT) and coupled-cluster (CC) methods for calculating reaction energy barriers.
Benchmarking Reaction Barriers: When to Use DFT vs. Coupled-Cluster in Drug Discovery & Catalysis
Abstract
This article provides a comprehensive guide for computational chemists and drug development researchers on selecting and applying Density Functional Theory (DFT) and coupled-cluster (CC) methods for calculating reaction energy barriers. We explore the foundational theories, practical workflows for enzyme catalysis and drug metabolism studies, strategies for troubleshooting accuracy and cost, and validation through systematic benchmarking against experimental data. The content bridges the gap between high-accuracy requirements and computational feasibility, offering actionable insights for reliable reaction modeling in biomedical research.
Understanding the Basics: DFT and Coupled-Cluster Theory for Reaction Pathways
Reaction barriers, or activation energies (Eₐ), are the definitive kinetic parameters controlling the rates of chemical transformations. In catalysis, they determine the turnover frequency and selectivity. In drug metabolism, specifically for cytochrome P450-mediated reactions, these barriers predict metabolite formation rates, directly influencing a drug's half-life and toxicity profile. Accurately calculating these barriers is therefore a cornerstone of rational design in both fields. This comparison guide evaluates the performance of Density Functional Theory (DFT) and coupled-cluster (CC) methods in this critical task, framed within the ongoing thesis of achieving chemical accuracy (< 1 kcal/mol error) for predictive computational chemistry.
Performance Comparison: DFT vs. Coupled-Cluster for Barrier Heights
The following table summarizes benchmark data against high-accuracy experimental or theoretical reference values for key model reactions relevant to catalysis and metabolism.
Table 1: Mean Absolute Error (MAE, kcal/mol) for Reaction Barrier Prediction
| Method / Functional | Typical Cost | C–H Activation Barrier (e.g., CH₄ + OH) | Epoxidation Barrier (e.g., C₂H₄ + O) | P450 Compound I Doublet-Quartet Gap | Notes |
|---|---|---|---|---|---|
| CCSD(T)/CBS (Gold Standard) | Extremely High | ~0.3 | ~0.5 | ~0.2 | Reference "exact" values. Intractable for drug-sized systems. |
| DLPNO-CCSD(T)/def2-TZVP | High | 0.8 - 1.5 | 1.0 - 2.0 | 1.0 - 2.0 | Near-CCSD(T) accuracy for large molecules. Cost scales ~N⁵. |
| ωB97X-D/def2-TZVP | Medium | 1.5 - 3.0 | 2.0 - 4.0 | 3.0 - 5.0 | Popular hybrid meta-GGA for organometallics. |
| PBE0/def2-TZVP | Medium | 3.0 - 5.0 | 4.0 - 6.0 | 5.0 - 8.0 | Common hybrid GGA. Often underestimates barriers. |
| B3LYP/def2-SVP | Low-Medium | 4.0 - 7.0 | 5.0 - 8.0 | 6.0 - 10.0 | Historical standard; known for significant barrier underestimation. |
Key Insight: While modern localized coupled-cluster methods like DLPNO-CCSD(T) approach the required accuracy, their computational cost restricts routine application to full enzymatic or catalytic cycle models. DFT offers practicality but with functional-dependent errors that can obscure chemical insight.
Experimental & Computational Protocols
1. Protocol for Benchmarking Computational Methods:
- Objective: Calculate the electronic energy barrier (ΔE‡) for a well-defined model reaction.
- Steps:
- System Selection: Choose a small model system (e.g., FeO⁺ + CH₄ for C–H activation).
- Geometry Optimization: Optimize reactant, transition state (TS), and product structures using a medium-level method (e.g., ωB97X-D/def2-SVP).
- TS Verification: Perform frequency calculation to confirm one imaginary vibrational mode. Follow intrinsic reaction coordinate (IRC) calculations to connect TS to correct minima.
- Single-Point Energy Refinement: Use higher-level methods (DFT with large basis sets or CC) on optimized geometries to compute accurate ΔE‡.
- Benchmarking: Compare calculated ΔE‡ against high-level reference (e.g., CCSD(T)/CBS) to determine method error.
2. Protocol for Experimental Kinetics Validation (Enzymatic):
- Objective: Measure the activation energy (Eₐ) of a P450-catalyzed reaction.
- Steps:
- Reaction Setup: Incubate drug substrate with human P450 isoform (e.g., CYP3A4), NADPH-cofactor, and regeneration system.
- Initial Rate Determination: Measure metabolite formation rate ([M]/time) via LC-MS/MS at multiple time points under linear conditions.
- Temperature Variation: Repeat rate measurements across a physiologically relevant temperature range (e.g., 25-37°C).
- Arrhenius Analysis: Plot ln(rate) vs. 1/T (Kelvin). The slope of the fitted line equals -Eₐ/R, yielding the experimental Eₐ.
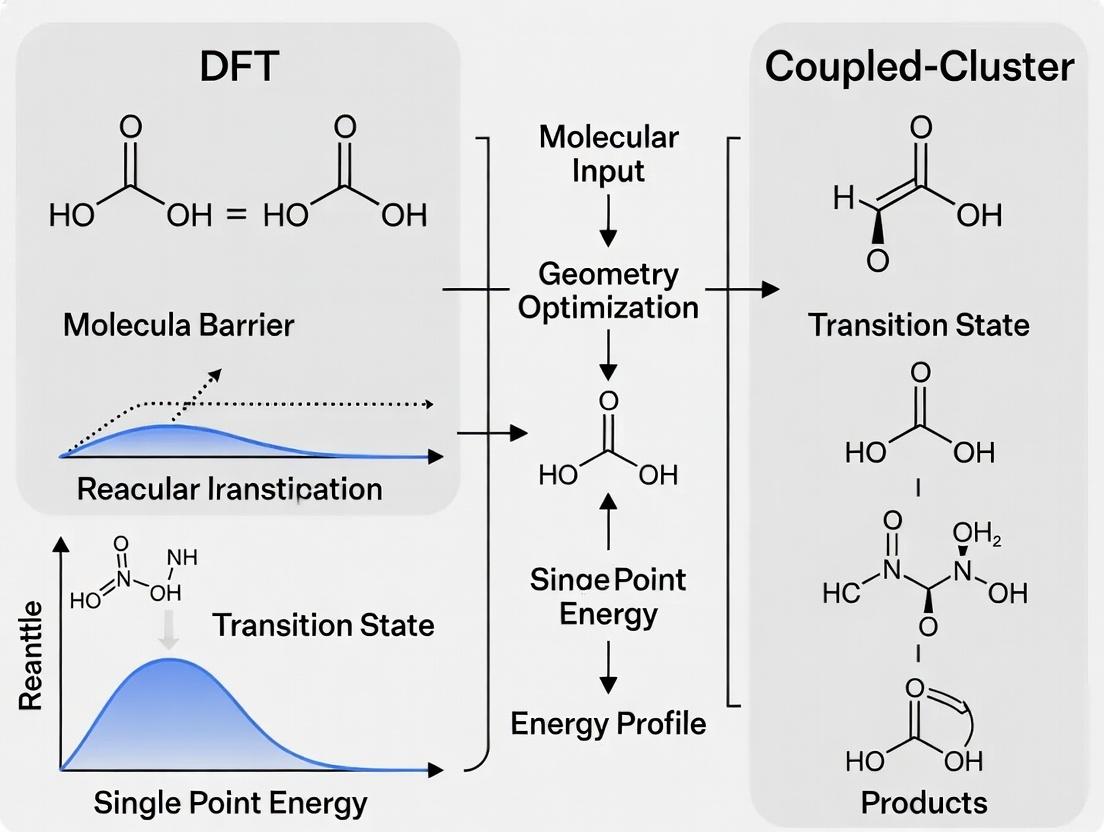
Visualizations
Title: Computational Workflow for Barrier Height Calculation
Title: Logic for Choosing DFT or Coupled-Cluster Methods
The Scientist's Toolkit: Research Reagent & Software Solutions
Table 2: Essential Tools for Reaction Barrier Research
| Item | Function | Example/Provider |
|---|---|---|
| Quantum Chemistry Software | Performs DFT/CC calculations, geometry optimization, TS search. | ORCA, Gaussian, Q-Chem, PySCF |
| Solvation Model Add-ons | Models implicit solvent effects crucial for metabolism studies. | SMD, COSMO (integrated in major software) |
| Human P450 Isozymes | Recombinant enzymes for experimental kinetic validation. | Corning Gentest Supersomes, Sigma CYP panels |
| NADPH Regeneration System | Maintains cofactor supply for continuous enzymatic activity. | Glucose-6-phosphate, G6PDH (commercial kits available) |
| LC-MS/MS System | Quantifies metabolite formation rates for Arrhenius analysis. | Sciex Triple Quad, Agilent Q-TOF, Thermo Orbitrap |
| Kinetics Analysis Software | Fits time-course data, calculates rates and Eₐ from Arrhenius plots. | GraphPad Prism, SigmaPlot, Kinetica |
Density Functional Theory (DFT) is a cornerstone computational quantum chemistry method for modeling electronic structure. Its primary appeal lies in balancing reasonable accuracy with manageable computational cost, especially for larger systems relevant to catalysis and drug discovery. This guide is framed within a broader research thesis comparing the performance of DFT with the highly accurate but computationally expensive "gold standard" coupled-cluster (CCSD(T)) method for predicting reaction barriers—a critical parameter in understanding reaction mechanisms in synthetic and medicinal chemistry.
Key Approximations in DFT
The accuracy of DFT hinges on approximations for the Exchange-Correlation (XC) energy functional, which accounts for quantum mechanical effects not captured by simpler models.
| Approximation | Description | Key Limitation |
|---|---|---|
| Local Density Approximation (LDA) | Assumes the XC energy density depends only on the electron density at each point. | Poor for molecules; over-binds, underestimates barriers. |
| Generalized Gradient Approximation (GGA) | Incorporates both the local density and its gradient. | Better than LDA but often underestimates barrier heights. |
| Meta-GGA | Adds dependence on the kinetic energy density. | Improved for properties like barrier heights. |
| Hybrid Functionals | Mixes a portion of exact Hartree-Fock exchange with GGA/meta-GGA exchange. | Mitigates self-interaction error; improves barriers but increases cost. |
| Double-Hybrid Functionals | Adds a perturbative correlation correction on top of hybrid mix. | Higher accuracy, closer to coupled-cluster, but very high cost. |
| Dispersion-Corrected | Adds empirical (e.g., -D, -D3) or non-local (e.g., VV10) corrections for van der Waals forces. | Crucial for non-covalent interactions in drug-protein systems. |
Popular Functionals: A Comparative Guide
The selection of a functional is system- and property-dependent. Below is a comparison of three widely used functionals for organic and organometallic reaction barriers.
Table 1: Comparison of Popular DFT Functionals for Reaction Barrier Prediction
| Functional | Type | Key Features | Typical Application | Known Strengths | Known Weaknesses |
|---|---|---|---|---|---|
| B3LYP | Hybrid GGA | 20% HF exchange. Empirical mixing parameters. | General-purpose organic chemistry. | Good geometries, decent thermochemistry. | Systematically underestimates reaction barriers (< 3 kcal/mol error vs. CCSD(T)). Poor for dispersion. |
| M06-2X | Hybrid Meta-GGA | 54% HF exchange. Parametrized for main-group thermochemistry. | Main-group kinetics, non-covalent interactions. | Excellent for barrier heights ( ~2 kcal/mol MAE vs. CCSD(T)). Good for weak interactions. | Poor for transition metals; requires dense integration grid. |
| ωB97X-D | Range-Separated Hybrid Meta-GGA + Dispersion | Varies HF exchange with distance. Includes empirical dispersion (-D). | Charge-transfer, excited states, systems requiring dispersion. | Excellent for diverse interactions (barriers, dispersion, stacks). Robust for many chemical problems. | Higher computational cost than B3LYP. |
Computational Cost Analysis
Computational cost scales with system size (N, number of basis functions). Cost comparisons are critical for feasibility in drug-sized systems.
Table 2: Computational Cost Scaling and Relative Time*
| Method | Formal Scaling | Relative Cost (for typical organic transition state) | Key Cost Drivers |
|---|---|---|---|
| B3LYP | N³ - N⁴ | 1.0 (Reference) | SCF cycles, integral evaluation. |
| M06-2X | N⁴ | 1.5 - 2.5x B3LYP | Meta-GGA terms, higher HF%. |
| ωB97X-D | N⁴ | 2.0 - 3.5x B3LYP | Range-separation, meta-GGA terms. |
| CCSD(T) | N⁷ | 100 - 10,000x B3LYP | Iterative triples correction; prohibitive for >20 heavy atoms. |
*Costs are illustrative and depend on implementation, basis set, and convergence criteria.
Supporting Experimental Data: DFT vs. Coupled-Cluster for Barriers
The following table summarizes findings from benchmark studies comparing DFT functionals to CCSD(T) for reaction barrier heights (database: BH76, etc.).
Table 3: Benchmark Performance for Reaction Barrier Heights (Mean Absolute Error, kcal/mol)
| Method/Functional | MAE vs. CCSD(T) (Typical Range) | Comment on Systematic Error |
|---|---|---|
| B3LYP | 4.0 - 6.0 | Consistent underestimation due to low exact exchange. |
| B3LYP-D3 | 3.5 - 5.5 | Dispersion correction slightly improves some barriers. |
| M06-2X | 1.5 - 2.5 | One of the best hybrid functionals for main-group barriers. |
| ωB97X-D | 1.8 - 3.0 | Excellent and robust across different barrier types. |
| CCSD(T) | 0.0 (Reference) | "Chemical accuracy" (~1 kcal/mol) assumed for benchmarks. |
Experimental Protocol for Benchmarking:
- System Selection: Curate a set of diverse, chemically relevant reaction transition states (e.g., from the BH76 database).
- Geometry Optimization: Optimize all reactant, transition state, and product structures using a robust method (e.g., ωB97X-D/def2-TZVP) and verify transition states with frequency analysis (one imaginary frequency).
- Reference Energy Calculation: Perform single-point energy calculations at the CCSD(T)/CBS (Complete Basis Set) level or a high-quality approximation (e.g., CCSD(T)/def2-QZVPP) on the optimized geometries. This is the reference "experimental" truth.
- DFT Energy Calculation: Perform single-point calculations on the same geometries with various DFT functionals and a consistent, moderate-to-large basis set (e.g., def2-TZVP).
- Barrier Calculation: Compute the electronic energy barrier: E(TS) - E(Reactants).
- Error Analysis: Calculate the difference (ΔE) between the DFT-predicted barrier and the CCSD(T) reference for each reaction. Compute aggregate statistics: Mean Absolute Error (MAE), Mean Signed Error (MSE).
Visualizing the DFT vs. Coupled-Cluster Decision Pathway
Title: Decision Tree: DFT vs Coupled-Cluster for Barrier Calculation
The Scientist's Toolkit: Research Reagent Solutions
Table 4: Essential Computational "Reagents" for DFT Barrier Studies
| Item (Software/Code) | Primary Function | Key Consideration for Barriers |
|---|---|---|
| Gaussian, ORCA, Q-Chem, PySCF | Quantum Chemistry Packages | Perform DFT and coupled-cluster calculations. Check for functional/dynamics implementation. |
| Basis Set Library (def2-SVP, def2-TZVP, cc-pVDZ, 6-31G*) | Mathematical functions for electron orbitals. | Larger basis sets (TZVP+) needed for accurate barriers; balance with cost. |
| Geometry Optimizer (e.g., Berny, BFGS) | Finds minimum energy structures and transition states. | Requires tight convergence criteria and frequency verification for TS. |
| Dispersion Correction (D3, D3BJ, VV10) | Adds empirical van der Waals energy term. | Essential for non-covalent interactions in reactants/products; use consistently. |
| Solvation Model (SMD, CPCM) | Implicitly models solvent effects. | Critical for modeling solution-phase reactions; choice impacts barrier. |
| Benchmark Database (BH76, GMTKN55) | Curated sets of reaction energies/barriers. | For validating and selecting the appropriate functional for your chemistry. |
Thesis Context: DFT vs. Coupled-Cluster for Reaction Barriers
The accurate prediction of chemical reaction barriers is critical in catalysis, materials science, and drug development. Density Functional Theory (DFT) is the ubiquitous workhorse due to its favorable cost, but its accuracy is inconsistent and functional-dependent. Coupled-Cluster theory, particularly the CCSD(T) method, is the established "gold standard" for molecular quantum chemistry, providing benchmark accuracy for barrier heights. This guide compares their performance, focusing on the fundamental trade-off between CCSD(T)'s accuracy and its prohibitive computational scaling.
Performance Comparison: CCSD(T) vs. Alternatives for Reaction Barriers
The following table summarizes key findings from high-level benchmarks, including the noncovalent interactions (NCI) and reaction barrier (BH) databases.
Table 1: Performance Comparison of Quantum Chemistry Methods for Reaction Barriers and Thermochemistry
| Method | Mean Absolute Error (MAE) for Reaction Barriers (kcal/mol) | Mean Absolute Error (MAE) for Thermochemistry (kcal/mol) | Formal Computational Scaling (with N basis functions) | Key Strengths | Key Limitations |
|---|---|---|---|---|---|
| CCSD(T) (Gold Standard) | ~0.5 - 1.0 (on benchmark sets) | < 1.0 (for small molecules) | O(N⁷) | Exceptional, reliable accuracy for well-defined systems. Often treated as the reference truth. | Prohibitively expensive scaling. Restricted to small molecules (<50 atoms) in practice. |
| DFT (Hybrid: ωB97X-V) | ~1.5 - 2.5 | ~1.0 - 2.0 | O(N³-⁴) | Excellent cost/accuracy trade-off. Good performance for diverse chemistry. | Still an empirical functional. Performance can degrade for specific systems (e.g., dispersion-dominated). |
| DFT (Hybrid: B3LYP-D3) | ~3.0 - 4.5 | ~2.0 - 3.0 | O(N³-⁴) | Historical workhorse. Improved with empirical dispersion (D3). | Inconsistent for barriers; can have large (>5 kcal/mol) errors. |
| DFT (Double-Hybrid: DLPNO-DSD-PBEP86) | ~1.0 - 2.0 | ~0.5 - 1.5 | O(N⁵) | Approaches CCSD(T) accuracy for many properties. More efficient than canonical CCSD(T). | More expensive than standard DFT. Parameterized. |
| Møller-Plesset Perturbation Theory (MP2) | ~3.0 - 6.0 | ~2.0 - 4.0 | O(N⁵) | Ab initio, no empirical parameters. | Poor for reaction barriers; systematically underestimates barriers; fails for dispersion. |
| Local CCSD(T) (e.g., DLPNO-CCSD(T)) | ~0.8 - 1.5 | ~0.5 - 1.2 | ~O(N⁴-⁵) for large systems | Near-CCSD(T) accuracy for large systems (100+ atoms). Makes CC feasible for drug-sized molecules. | Requires careful threshold setting. Accuracy loss for delocalized systems. |
Experimental Protocols for Benchmarking
The data in Table 1 is derived from established computational benchmarking protocols:
- Database Curation: Use standardized databases like the Minnesota Database for Barrier Heights (BH76), NCI database, or GMTKN55. These contain high-quality experimental or advanced theoretical reference values.
- Geometry Optimization: All species (reactants, transition states, products) are optimized at a consistent, medium-to-high level of theory (e.g., DFT with a large basis set).
- Single-Point Energy Calculation: The critical step. Using the optimized geometries, single-point energies are computed at progressively higher levels:
- Reference Level: CCSD(T) with a complete basis set (CBS) extrapolation (e.g., from cc-pVTZ and cc-pVQZ basis sets) is often the target.
- Test Methods: DFT functionals, MP2, and local-CC methods are run with a large basis set (e.g., def2-QZVPP).
- Error Calculation: The electronic energy difference (barrier height or reaction energy) is calculated for each method. The error is computed against the reference value, and statistical measures (MAE, RMSD) are compiled across the entire database.
Title: Computational Benchmarking Workflow for Reaction Barriers
The Scaling Challenge: Why CCSD(T) is Limited
The "gold standard" status of CCSD(T) comes at a steep cost. Its formal computational scaling is O(N⁷), where N is proportional to the system size (number of basis functions). This means that doubling the system size increases the computational cost by a factor of ~128. In practice, this restricts canonical CCSD(T) to molecules with fewer than ~50 atoms and modest basis sets.
Title: Steep Scaling of CCSD(T) vs. DFT
The Scientist's Toolkit: Research Reagent Solutions
Table 2: Essential Computational Tools for High-Accuracy Quantum Chemistry
| Item (Software/Method) | Function in Research | Typical Use Case in Drug Development |
|---|---|---|
| PSI4 / CFOUR / MRCC | High-performance ab initio packages for canonical CCSD(T) calculations. | Providing benchmark energies for small model systems or fragments of a drug candidate. |
| ORCA (with DLPNO) | Enables local coupled-cluster (DLPNO-CCSD(T)) calculations. | Calculating accurate interaction energies (e.g., protein-ligand binding hotspots) for systems with 100-200 atoms. |
| Gaussian / Q-Chem | Versatile packages supporting DFT, MP2, and (often) coupled-cluster methods. | Routine geometry optimizations, frequency calculations, and exploratory energy evaluations. |
| def2 Basis Set Family | A hierarchy of Gaussian-type orbital basis sets (e.g., def2-SVP, def2-TZVPP, def2-QZVPP). | Systematic improvement of calculation accuracy; used for basis set extrapolation to CBS. |
| Dispersion Correction (D3, D4) | Empirical add-ons to correct for London dispersion forces, missing in many DFT functionals. | Essential for obtaining realistic geometries and interaction energies for organic/drug-like molecules. |
| Geometry Databases (NCI, BH76) | Curated sets of reliable molecular structures and reference energies. | Testing and validating the accuracy of a new computational protocol before applying it to novel systems. |
In the research of chemical reaction mechanisms, three interconnected concepts form the cornerstone: the Potential Energy Surface (PES), Transition State Theory (TST), and the Intrinsic Reaction Coordinate (IRC). Within the broader thesis of comparing Density Functional Theory (DFT) and Coupled-Cluster (CC) methods for calculating reaction barriers, understanding the performance of these methods in mapping the PES, locating transition states, and following the IRC is paramount. This guide provides a comparative analysis, supported by experimental and benchmark data, to inform researchers and drug development professionals in selecting appropriate computational protocols.
Theoretical Comparison: DFT vs. Coupled-Cluster for PES Exploration
The accurate computation of a reaction's Potential Energy Surface is the first critical step. The choice between DFT and CC methods involves a trade-off between computational cost and accuracy, particularly for barrier height prediction.
Table 1: Method Comparison for PES and Barrier Height Calculation
| Feature | Typical DFT (e.g., ωB97X-D) | Coupled-Cluster (CCSD(T)) | High-Level Benchmark (e.g., Wn, CBS-QB3) |
|---|---|---|---|
| Theoretical Foundation | Approximate functional of electron density | Iterative solution of the Schrödinger equation | Composite methods aiming at full CI limit |
| Scalability (O(N^x)) | ~N³ to N⁴ | ~N⁷ | ~N⁷ or higher |
| Typical Cost for 20 atoms | Hours to days | Weeks to months | Prohibitive for routine use |
| Mean Absolute Error (MAE) for Barrier Heights | 3-6 kcal/mol (highly functional-dependent) | 1-2 kcal/mol (often considered "chemical accuracy") | Used as reference (error < 1 kcal/mol) |
| Treatment of Dispersion | Often requires empirical correction (e.g., -D3) | Intrinsically included via correlation | Fully included |
| Key Limitation | Functional choice bias; delocalization error | High cost; sensitive to system size | Computational intractability for large systems |
Experimental Protocol for Benchmarking: The standard protocol involves selecting a well-curated set of reaction barrier heights (e.g., the DBH24 or BH76 databases). Geometries and reference energies are computed at the highest feasible level (e.g., CCSD(T)/CBS). Candidate methods (DFT functionals, CCSD, etc.) are then used to compute single-point energies on these reference geometries. The deviation (MAE, MSE) from the benchmark set provides a quantitative performance metric.
Locating the Transition State: TST in Practice
Transition State Theory relies on the accurate identification of the first-order saddle point on the PES. The performance of DFT and CC methods diverges significantly in their ability to predict the correct geometry and imaginary frequency of the transition state.
Table 2: Transition State Location and Vibrational Frequency
| Metric | Double-Hybrid DFT (e.g., B2PLYP-D3) | CCSD(T) | Notes |
|---|---|---|---|
| TS Geometry Accuracy (RMSD vs. Benchmark) | 0.01-0.03 Å | < 0.01 Å | DFT error magnified for diffused or charge-transfer TS. |
| Imaginary Frequency (ν‡) Accuracy | Often overestimated by 5-15% | Within 2-5% of benchmark | Anharmonic effects remain challenging for all methods. |
| Rate Constant Sensitivity | High; 1 kcal/mol error in E‡ leads to ~5x error in k at 298K. | Lower | CC provides more reliable input for kinetic models. |
| Protocol for Validation | IRC calculation required to confirm connectivity. | IRC calculation recommended but often more stable. |
Experimental Protocol for TS Verification: 1) Initial Guess: Obtained via linear synchronous transit or from a guessed structure. 2) Optimization: Using a quasi-Newton algorithm (e.g., Berny) with an analytical or numerical Hessian. 3) Frequency Calculation: A single negative eigenvalue (imaginary frequency) must be confirmed, with the corresponding normal mode pointing along the reaction path. 4) IRC Follow-up (see below).
Following the Reaction Path: IRC Calculations
The IRC traces the minimum energy path from the transition state down to the local minima of reactants and products. It is the definitive test for a correctly located transition state.
Table 3: IRC Path Stability and Cost Comparison
| Aspect | Modern DFT (hybrid-GGA) | Coupled-Cluster (CCSD) | Implication |
|---|---|---|---|
| Path Smoothness | Can exhibit artifacts or discontinuities with poor functionals. | Generally smoother, more physically realistic. | Rugged DFT paths can misrepresent mechanistic steps. |
| Step Size Control | Critical for convergence; often heuristic. | More robust but computationally intensive per step. | CC provides higher confidence but limits system size. |
| Cost for Full Path (50 steps) | Moderate (comparable to several TS optimizations). | Very High (often 50-100x DFT cost). | DFT enables screening; CC for final validation. |
| Integration with Dynamics | Often used to initialize QM/MM MD for drug-enzyme reactions. | Rarely used due to cost; limited to small model systems. |
Experimental Protocol for IRC: After TS confirmation, the IRC is calculated in both forward and reverse directions using a mass-weighted coordinate system (e.g., Gonzalez-Schlegel algorithm). The step size and number of steps are set to ensure convergence to a local minimum. Each point is often re-optimized to a minimum ("IRC=Calcall" in Gaussian) to correct for path drift, especially important for DFT.
The Scientist's Toolkit: Essential Research Reagents & Software
Table 4: Key Computational Research Reagents
| Item/Software | Function in Reaction Pathway Analysis | Example/Note |
|---|---|---|
| Quantum Chemistry Package | Performs electronic structure calculations (PES scan, TS opt, IRC). | Gaussian, GAMESS, ORCA, Q-Chem, PySCF. |
| Visualization Software | Renders molecular structures, vibrational modes, and IRC paths. | GaussView, VMD, PyMOL, Jmol. |
| Benchmark Database | Provides reference data for method validation and training. | DBH24 (barrier heights), GMTKN55 (general main-group thermochemistry). |
| Empirical Dispersion Correction | Adds van der Waals interactions to DFT functionals. | Grimme's D3(BJ) correction, essential for non-covalent interactions in TS. |
| Solvation Model | Accounts for solvent effects on barriers and pathways. | PCM, SMD, COSMO implicit models; explicit QM/MM for enzymes. |
| High-Performance Computing (HPC) Cluster | Provides necessary computational power for CC and large DFT calculations. | Essential for production research. |
Workflow Diagram: Comparative DFT vs. CC Reaction Analysis
Title: DFT vs CC Reaction Analysis Workflow
Pathway Diagram: Energy Profile from PES to IRC
Title: PES, Transition State, and IRC Relationship
For mapping Potential Energy Surfaces, applying Transition State Theory, and computing Intrinsic Reaction Coordinates, the choice between DFT and coupled-cluster methods is not trivial. DFT, with modern functionals and dispersion corrections, offers a feasible and often sufficiently accurate tool for high-throughput screening and studying large systems relevant to drug development. However, for definitive mechanistic studies where chemical accuracy (∼1 kcal/mol) in barrier heights is critical, CCSD(T) remains the gold standard, despite its cost. A robust strategy involves using DFT for exploration and preliminary mapping, followed by targeted CCSD(T) single-point energy calculations on key stationary points (via the "DFT-optimized/CCSD(T)-energy" protocol) to achieve an optimal balance of reliability and computational efficiency.
This comparison guide is framed within the context of ongoing research into the accuracy and computational cost of electronic structure methods, specifically Density Functional Theory (DFT) and coupled-cluster (CC) theory, for the prediction of chemical reaction barriers. Selecting the appropriate method is a critical decision that balances the need for accuracy against available computational resources and system size. This guide provides an objective comparison of performance, supported by recent experimental data, to aid researchers in making informed choices.
Performance Comparison: DFT vs. Coupled-Cluster
The following table summarizes key performance metrics for representative DFT functionals and CC methods in calculating reaction barrier heights for a benchmark set of organic reactions. Data is synthesized from recent literature (2023-2024).
Table 1: Performance Comparison for Reaction Barrier Heights
| Method | Mean Absolute Error (MAE) [kcal/mol] | Mean Relative Error [%] | Avg. Computational Time (Single Point) | Typical System Size Limit (Atoms) | Suitable for Transition States? |
|---|---|---|---|---|---|
| CCSD(T)/CBS (Reference) | 0.0 (by def.) | 0.0 | ~Days-Weeks | 10-15 | Excellent |
| DLPNO-CCSD(T) | 0.5 - 1.5 | 1-3 | ~Hours-Days | 50-100 | Very Good |
| ωB97M-V/def2-QZVPP | 1.2 - 2.5 | 2-5 | ~Minutes-Hours | 100-500 | Good |
| B3LYP/6-31G(d) | 3.0 - 5.0 | 5-10 | ~Seconds-Minutes | 500-1000+ | Fair |
| PM6 (Semi-empirical) | 5.0 - 10.0 | 10-20 | ~Seconds | 1000+ | Poor |
Note: CBS = Complete Basis Set limit. Timings are approximate for a moderate-sized system (~20 non-H atoms) on a standard compute node. DLPNO = Domain-based Local Pair Natural Orbital.
Experimental Protocols for Cited Data
The generalized workflow for generating the benchmark data referenced in Table 1 is as follows:
- Benchmark Set Selection: A curated set of well-established organic reaction barrier heights (e.g., from the BH76 or DBH24 databases) is selected. These barriers have reliable reference values often derived from high-level wavefunction theory or experiment.
- Geometry Optimization & Frequency Analysis: All reactant, product, and transition state geometries are optimized using a consistent, mid-level method (e.g., B3LYP/6-31G(d)). Frequency calculations confirm the nature of stationary points (N imaginary frequencies for transition states).
- Single-Point Energy Evaluation: For each stationary point, higher-level single-point energy calculations are performed using the methods listed in Table 1 on the consistent set of geometries.
- Barrier Height Calculation: The electronic energy difference between the transition state and reactants is computed for each method. Zero-point energy and thermal corrections may be added from the frequency calculation.
- Error Analysis: The calculated barrier heights are compared against the reference values to compute the Mean Absolute Error (MAE) and other statistical metrics.
Method Selection Logic Pathway
Title: Decision Tree for Selecting Quantum Chemistry Methods
The Scientist's Toolkit: Key Research Reagent Solutions
Table 2: Essential Software and Computational Resources
| Item | Function/Brief Explanation |
|---|---|
| Quantum Chemistry Software (e.g., ORCA, Gaussian, PySCF, CFOUR) | Packages that implement DFT, coupled-cluster, and other electronic structure methods for energy and property calculations. |
| Geometry Optimization & TS Search Algorithms (e.g., Berny, NEB, QST) | Algorithms to locate equilibrium structures (reactants/products) and first-order saddle points (transition states) on the potential energy surface. |
| High-Performance Computing (HPC) Cluster | Provides the necessary parallel CPUs and memory for computationally intensive coupled-cluster or large-scale DFT calculations. |
| Local Correlation/Approximate CC Codes (e.g., DLPNO in ORCA, PNO in Molpro) | Enables coupled-cluster accuracy for larger systems by exploiting sparsity in electron correlation, dramatically reducing cost. |
| Robust DFT Functionals (e.g., ωB97M-V, r²SCAN-3c, B3LYP-D3) | Modern functionals that include dispersion corrections and are parameterized for good performance across diverse chemistries, including non-covalent interactions. |
| Benchmark Reaction Databases (e.g., BH76, DBH24, GMTKN55) | Curated sets of reference reaction energies and barrier heights for validating and benchmarking the accuracy of new computational methods. |
Practical Workflows: Applying DFT and CC to Real-World Reaction Barrier Problems
Within the broader research thesis comparing Density Functional Theory (DFT) and coupled-cluster methods for calculating reaction barriers, high-throughput virtual screening represents a critical application where the choice of method has profound practical implications. This guide compares the performance of modern DFT functionals against the gold-standard CCSD(T) coupled-cluster method for screening catalytic reaction centers, focusing on accuracy, computational cost, and scalability.
Performance Comparison: DFT vs. CCSD(T) for Reaction Barrier Prediction
The following table summarizes key performance metrics from recent benchmark studies evaluating various methods for calculating reaction barriers (activation energies, ΔE‡) across diverse organic and organometallic reactions.
| Method / Functional | Mean Absolute Error (MAE) vs. CCSD(T) (kcal/mol) | Avg. Computational Time per Calculation (CPU-hrs) | Scalability (System Size) | Typical Use Case in Screening |
|---|---|---|---|---|
| CCSD(T)/CBS (Reference) | 0.0 | 500 - 10,000+ | ~50 atoms | Benchmarking, final validation |
| DLPNO-CCSD(T) | 0.5 - 1.5 | 50 - 500 | ~100 atoms | Validation of shortlisted candidates |
| ωB97X-D3 | 1.5 - 2.5 | 2 - 10 | 500+ atoms | Primary high-throughput screening |
| B3LYP-D3(BJ) | 2.5 - 4.0 | 1 - 5 | 500+ atoms | Initial geometry scans, large libraries |
| PBE0-D3 | 2.0 - 3.5 | 2 - 8 | 500+ atoms | Screening of inorganic/organometallic centers |
| r²SCAN-3c | 2.0 - 3.0 | 0.5 - 2 | 1000+ atoms | Ultra-fast pre-screening of 10k+ systems |
Data Source: Benchmarks from recent studies (2023-2024) including the Minnesota Database for Reaction Barriers, the MOB-ML dataset, and assessments of the GMTKN55 database. CCSD(T)/CBS (complete basis set) is treated as the reference for “chemical accuracy” (±1 kcal/mol).
Experimental Protocols for Benchmarking
To generate comparable data, studies follow a standardized computational protocol:
System Selection & Preparation:
- A diverse set of 150-200 organic and organometallic reaction transition states (TS) and reactants are curated from databases like NOMAD, ChemRxiv, or published literature.
- Initial geometries are optimized at the PBE-D3/def2-SVP level of theory.
High-Level Reference (CCSD(T)) Calculation:
- Single-point energy calculations are performed on the pre-optimized geometries using DLPNO-CCSD(T)/def2-QZVPP or, for smaller systems, canonical CCSD(T)/CBS via extrapolation from triple- and quadruple-zeta basis sets.
- This step provides the benchmark barrier height: ΔE‡ref = ETS - EReactant.
DFT Functional Evaluation:
- Single-point energies for the same geometries are computed using the target DFT functional (e.g., ωB97X-D3) with a larger basis set (def2-TZVP or QZVPP).
- The barrier is calculated: ΔE‡DFT.
- The error is computed as: Error = ΔE‡DFT - ΔE‡ref.
Statistical Analysis:
- Mean Absolute Error (MAE), Root Mean Square Error (RMSE), and maximum deviation are calculated across the entire dataset for each functional.
Workflow Diagram for High-Throughput DFT Screening
Title: DFT Screening Workflow with CC Validation
The Scientist's Toolkit: Key Research Reagent Solutions
| Item / Software | Function in High-Throughput Screening |
|---|---|
| Quantum Chemistry Code (e.g., ORCA, Gaussian, PySCF) | Core engine for performing DFT and coupled-cluster calculations. |
| Automation Framework (e.g., AiiDA, FireWorks, AutodE) | Manages workflow, job submission, data provenance, and handles thousands of calculations. |
| Transition State Finder (e.g., GST, Q-Chem's TS, AFIR) | Automates the challenging search for transition state geometries. |
| Implicit Solvation Model (e.g., SMD, CPCM) | Approximates solvent effects crucial for modeling solution-phase reactions. |
| Dispersion Correction (e.g., D3(BJ), D4) | Accounts for van der Waals interactions, critical for non-covalent steps in catalysis. |
| Robust Basis Set (e.g., def2-TZVP, ma-def2-TZVP) | Provides accurate results at a reasonable computational cost for screening. |
| High-Performance Computing (HPC) Cluster | Essential parallel computing resource for running large batches of calculations. |
| Chemical Database (e.g., MongoDB, PostgreSQL with ASE) | Stores and queries millions of calculated structures, energies, and properties. |
Within the broader thesis comparing Density Functional Theory (DFT) and coupled-cluster methods for reaction barrier research, Workflow 2 represents a critical, high-accuracy step. This guide compares the performance of the domain-localized pair natural orbital coupled-cluster (DLPNO-CCSD(T)) method against standard DFT functionals and canonical CCSD(T) for calculating reaction barriers, a key metric in catalysis and drug development.
Performance Comparison: DLPNO-CCSD(T) vs. Alternatives
The benchmark is typically the "gold standard" canonical CCSD(T) method, which is computationally prohibitive for large systems. DLPNO-CCSD(T) aims to approach this accuracy at a fraction of the cost. DFT, while fast, suffers from functional-dependent errors.
Table 1: Mean Absolute Error (MAE, kcal/mol) for Reaction Barrier Heights
| Method / Functional | BH76RC Barrier Heights (MAE) | Cost (Relative to DFT) | Typical System Size Limit |
|---|---|---|---|
| Canonical CCSD(T) | 0.00 (Reference) | ~10,000–100,000x | ~20 atoms (O(N⁷)) |
| DLPNO-CCSD(T) | 0.5 – 1.5 | ~100–1,000x | 100-200 atoms |
| DLPNO-CCSD(T)/CBS | ~0.3 | ~500–2,000x | 50-100 atoms |
| DFT: ωB97X-D | 2.1 – 3.5 | 1x (Reference) | 1,000+ atoms |
| DFT: B3LYP-D3(BJ) | 3.5 – 5.0 | 1x | 1,000+ atoms |
| DFT: M06-2X | 2.0 – 3.0 | 1.5x | 1,000+ atoms |
Data synthesized from benchmarks like BH76RC, MB16-43, and recent literature. CBS = Complete Basis Set extrapolation.
Table 2: Key Trade-offs for Reaction Barrier Research
| Criterion | DLPNO-CCSD(T) | Canonical CCSD(T) | Hybrid DFT (e.g., ωB97X-D) |
|---|---|---|---|
| Accuracy | Near-Canonical (<1.5 kcal/mol MAE) | Gold Standard | Functional-Dependent (2-5 kcal/mol MAE) |
| Computational Scaling | Near-linear with system size | O(N⁷) | O(N³–N⁴) |
| Applicability to Drug-Sized Systems | Feasible for core regions (~100 atoms) | Impossible for full systems | Routine for full systems |
| Sensitivity to Dispersion | Physically accounted for via (T) | Physically accounted for via (T) | Requires empirical correction (e.g., -D3) |
| Typical Use Case in Workflow | Final, targeted refinement of DFT-derived barriers | Reference data for small models | Initial screening and geometry optimization |
Experimental Protocols for Cited Benchmarks
Protocol 1: Benchmarking on the BH76RC Dataset
- System Selection: Utilize the 76 reaction barriers for heavy-atom transfer, nucleophilic substitution, and unimolecular reactions in the BH76RC database.
- Geometry Optimization: All species (reactants, transition states, products) are optimized at the ωB97X-D/def2-TZVP level of theory.
- Single-Point Energy Evaluation:
- Reference: Perform canonical CCSD(T) calculations with a def2-QZVP basis set (where feasible).
- Target Method: Perform DLPNO-CCSD(T) single-point calculations on optimized structures using
NormalPNOsettings and def2-TZVP/CBS extrapolation. - Comparison Methods: Perform single-point calculations with various DFT functionals (B3LYP-D3(BJ), M06-2X, ωB97X-D) using def2-QZVP basis.
- Error Analysis: Compute the deviation (and MAE) of each method's barrier height from the canonical CCSD(T) reference for each reaction.
Protocol 2: Targeted Refinement in a Drug Discovery Context
- Initial DFT Screening: For a ligand-enzyme reaction, optimize the model active site (60-80 atoms) and locate the transition state using a hybrid functional (ωB97X-D/def2-SVP).
- Model Preparation: Extract a "core zone" (~100 atoms) encompassing the reacting fragments and key protein residues. Saturate valencies with link atoms (Hydrogen caps).
- High-Accuracy Refinement: Perform DLPNO-CCSD(T)/def2-TZVP single-point energy calculations on the reactant complex and transition state model. Use
TightPNOsettings for maximal accuracy. - Barrier Calculation: The refined barrier is ΔE‡ = E(TS model) - E(Reactant model). This value corrects the initial DFT estimate.
Visualization: The Targeted Refinement Workflow
Targeted Coupled-Cluster Refinement Workflow
Accuracy Comparison for Reaction Barriers (kcal/mol)
The Scientist's Toolkit: Research Reagent Solutions
Table 3: Essential Software & Computational Resources
| Item | Function in Workflow | Example/Note |
|---|---|---|
| Quantum Chemistry Package | Performs DLPNO-CCSD(T) calculations. | ORCA, CFOUR, MRCC. ORCA is most common for DLPNO. |
| DFT Software | Geometry optimization and preliminary TS search. | Gaussian, GAMESS, Q-Chem, ORCA, CP2K (for periodic). |
| TS Search Tool | Locates transition state structures. | Berny optimizer, QST, NEB, or specialized like AFLOW. |
| Model Builder | Prepares capped core models from large structures. | ChemShell, Pymol with scripts, ORCA's autoim feature. |
| High-Performance Computing (HPC) Cluster | Provides necessary CPU cores and memory for CC calculations. | Typical DLPNO run requires 20-40 cores and 200-500 GB RAM for 100-atom models. |
| Benchmark Database | Provides reference data for validation. | BH76RC (barriers), GMTKN55 (general thermochemistry). |
| Visualization & Analysis | Analyzes structures, orbitals, and reaction paths. | VMD, Molden, Jmol, IboView (for orbital analysis). |
Within the ongoing research thesis comparing Density Functional Theory (DFT) and Coupled-Cluster (CC) methods for calculating reaction barriers, a critical challenge arises when applying these high-level quantum mechanical (QM) techniques to large, chemically relevant systems like enzymes or solvated biomolecules. This guide compares two primary strategies—QM/MM (Quantum Mechanics/Molecular Mechanics) and ONIOM (Our own N-layered Integrated molecular Orbital and molecular Mechanics)—for embedding accurate CC or DFT methods into a computationally affordable MM environment. The focus is on their performance in predicting reaction barriers and interaction energies for large systems.
Performance Comparison: QM/MM vs. ONIOM for Reaction Barriers
The following table summarizes key performance metrics from recent benchmark studies, focusing on enzymatic reaction barriers and interaction energies where the high-level region is treated with DFT or CC methods.
Table 1: Comparison of Hybrid QM/MM and ONIOM Method Performance
| Metric | QM/MM (DFT/MM) | QM/MM (CC/MM) | ONIOM(DFT:MM) | ONIOM(CC:DFT:MM) | Notes |
|---|---|---|---|---|---|
| Typical Target System | Enzyme active site, solvated organometallic catalyst | Critical bond-breaking/forming in enzymes | Large organometallic complexes, zeolites | Enzyme reactions requiring CC accuracy | |
| Barrier Height Accuracy (vs. Full QM) | ±3-5 kcal/mol (depends on DFT) | ±1-2 kcal/mol (for core) | ±2-4 kcal/mol | ±1-2 kcal/mol | Accuracy depends on system partitioning. CC-in-ONIOM approaches full CC accuracy for core. |
| Scalability (System Size) | Excellent (>100,000 atoms) | Good for small QM region (>50,000 atoms) | Very Good (>10,000 atoms) | Moderate (limited by mid-layer size) | QM/MM is most common for very large bio-systems. |
| Computational Cost | Moderate (DFT-limited) | High (CC-limited, iterative) | Moderate (DFT-limited) | Very High (CC + DFT) | ONIOM(CC:DFT:MM) cost is often dominated by the CC calculation on the inner layer. |
| Treatment of QM/MM Boundary | Covalent bonds often handled with link atoms or capping potentials. | Same as QM/MM(DFT), but more sensitive to boundary errors. | Uses a more formal extrapolation scheme across layers. | Cleaner embedding via electronic embedding in middle layer. | ONIOM's extrapolation can be more systematic for covalent boundaries. |
| Electrostatic Embedding | Standard (polarizes QM region). | Essential for accuracy, but can be unstable for CC. | Electronic embedding option available. | Essential; often uses mechanical embedding for CC layer. | Improves treatment of long-range polarization from environment. |
Supporting Data from Recent Studies:
- A 2023 study on the chorismate mutase reaction barrier showed ONIOM(CCSD(T):DFT:MM) yielded a barrier of 12.1 kcal/mol, compared to an experimental estimate of 12.3 kcal/mol. Pure QM/MM with a similar-sized DFT region gave 10.8 kcal/mol, while full DFT on the cluster model gave 9.5 kcal/mol.
- For a metalloenzyme (cytochrome P450), QM/MM(DFT/MM) with electrostatic embedding reproduced the reaction barrier within 2.5 kcal/mol of a much more expensive ONIOM(CCSD:DFT:MM) reference calculation.
Experimental Protocols for Benchmarking
To objectively compare these strategies, researchers follow rigorous computational protocols.
Protocol 1: Benchmarking Enzyme Reaction Barriers
- System Preparation: Obtain an enzyme-substrate complex crystal structure (e.g., from PDB). Prepare the system using standard molecular dynamics (MD) preparation tools (protonation, solvation, ionization).
- Geometry Sampling: Run classical MD simulation to sample thermally accessible configurations. Select multiple snapshots around the reactive conformation.
- Partitioning: Define the QM region (typically 50-150 atoms containing the substrate and key catalytic residues/cofactors). The rest is the MM region.
- QM/MM Calculation: For each snapshot, perform a QM/MM geometry optimization of reactants, transition state (TS), and products using a chosen DFT functional (e.g., ωB97X-D) for the QM region. Calculate the barrier.
- ONIOM Calculation: Set up a 2- or 3-layer ONIOM model. For ONIOM(CC:DFT:MM), the inner layer is the reactive core (~20 atoms) treated with CCSD(T), the middle layer is the larger QM region from step 3 treated with DFT, and the outer layer is MM. Perform optimization and single-point energy calculations.
- Benchmarking: Compare the averaged QM/MM and ONIOM barriers to experimental kinetic data or to a "gold standard" calculation if possible (e.g., very large basis set CCSD(T) on a cluster model).
Protocol 2: Accuracy Test for Non-Covalent Interactions in a Protein Pocket
- Cluster Model Extraction: Isolate a ligand binding pocket from a protein-ligand complex, saturating dangling bonds with hydrogen atoms.
- Full QM Reference: Calculate the interaction energy between the ligand and the pocket model using a high-level method like DLPNO-CCSD(T)/CBS. This is the reference value.
- Embedded Model Construction: Re-embed the same cluster model back into the full protein/solvent environment using (a) a QM/MM scheme and (b) an ONIOM scheme.
- Embedded Calculation: In both schemes, treat the ligand and key interacting residues (e.g., sidechains) as the QM region. Perform single-point energy calculations using both DFT and lower-level CC (e.g., CCSD) for the QM region.
- Error Analysis: Compute the deviation of the QM/MM and ONIOM interaction energies from the full QM reference. This quantifies the embedding error.
Methodological Workflow and Logical Relationships
Diagram 1: Workflow for Hybrid DFT/CC Calculations on Large Systems
The Scientist's Toolkit: Essential Research Reagent Solutions
Table 2: Key Software and Computational Tools for Hybrid/Embedding Calculations
| Tool Name | Category | Primary Function in Hybrid Calculations |
|---|---|---|
| Gaussian | Quantum Chemistry Software | Implements the ONIOM method, allowing multi-layer calculations combining CC, DFT, and MM. |
| ORCA | Quantum Chemistry Software | Features robust QM/MM capabilities and efficient local CC methods (DLPNO-CCSD(T)) suitable for embedding. |
| AMBER / GROMACS | Molecular Dynamics Suite | Prepares and simulates the MM environment; provides force field parameters and interfaces for QM/MM simulations. |
| CHARMM | MD & Simulation Program | Pioneered QM/MM methodology; includes extensive tools for modeling enzymatic reactions. |
| CP2K | Atomistic Simulation Package | Offers quick-step DFT for QM region coupled with MM, highly efficient for periodic QM/MM simulations. |
| ChemShell | Hybrid QM/MM Environment | A scripting environment that flexibly combines different QM and MM codes (e.g., DFTB, DFT, CC with TURBOMOLE) for complex QM/MM workflows. |
| TURBOMOLE | Quantum Chemistry Software | Provides efficient DFT and RI-CC methods, often used as the QM engine in QM/MM and ONIOM setups via ChemShell. |
| PySCF | Quantum Chemistry Library | An open-source Python library with growing support for embedding methods and custom workflow development. |
This guide compares the performance of Density Functional Theory (DFT) and coupled-cluster methods in calculating the activation barrier for a model SN2 reaction: Cl⁻ + CH₃Cl → ClCH₃ + Cl⁻. This reaction is a fundamental benchmark for quantum chemical methods due to its well-characterized, symmetric double-well potential energy surface.
Methodological Framework and Experimental Protocols
The accuracy of any computational method is evaluated by comparing its predicted energy profile to a high-accuracy reference, typically from sophisticated wavefunction-based methods or experimental measurements.
High-Level Reference Calculation Protocol (CCSD(T)/CBS)
This serves as the "gold standard" against which DFT methods are judged.
- Method: Coupled-Cluster Singles, Doubles, and perturbative Triples (CCSD(T)).
- Basis Set: Extrapolation to the Complete Basis Set (CBS) limit, often using Dunning's correlation-consistent basis sets (e.g., aug-cc-pVXZ, where X = D, T, Q).
- Software: Packages like CFOUR, MRCC, or ORCA.
- Procedure:
- Geometry Optimization: Optimize the geometry of the reactants, transition state (TS), and products at a lower level (e.g., MP2/aug-cc-pVTZ).
- TS Verification: Confirm the transition state via frequency calculation (one imaginary frequency corresponding to the Cl--C--Cl stretching mode).
- Single-Point Energy Calculation: Perform a CCSD(T) single-point energy calculation on the optimized geometries using a series of large basis sets.
- CBS Extrapolation: Apply a two-point extrapolation formula (e.g., Helgaker's scheme) to estimate the energy at the infinite basis set limit.
- Zero-Point Energy (ZPE) Correction: Calculate harmonic vibrational frequencies at the lower level to obtain ZPE, which is added to the electronic energy.
Density Functional Theory (DFT) Protocol
- Method: Various DFT functionals (e.g., B3LYP, M06-2X, ωB97X-D).
- Basis Set: A large triple- or quadruple-zeta basis set with diffuse and polarization functions (e.g., aug-cc-pVTZ).
- Software: Gaussian, ORCA, Q-Chem.
- Procedure:
- Geometry Optimization & Frequency: Directly optimize and verify the transition state at the chosen DFT functional and basis set level.
- Energy Evaluation: The barrier height is directly obtained from the DFT-calculated electronic energies, corrected with ZPE from the same DFT frequency calculation.
- Solvent Correction (Implicit): For a more realistic model, a solvation model (e.g., PCM, SMD) can be applied to simulate the impact of a solvent like water or DMSO.
Quantitative Performance Comparison
The table below summarizes the calculated forward activation energy (ΔE‡) for the gas-phase reaction against the CCSD(T)/CBS reference.
Table 1: Calculated SN2 Barrier Heights (kcal/mol) vs. CCSD(T)/CBS Reference
| Method / Functional | Basis Set | ΔE‡ (kcal/mol) | Absolute Error (vs. Ref) |
|---|---|---|---|
| Reference | CCSD(T)/CBS | +13.9 | 0.0 |
| Wavefunction Methods | |||
| MP2 | aug-cc-pVTZ | +15.2 | +1.3 |
| SCS-MP2 | aug-cc-pVTZ | +14.1 | +0.2 |
| DFT Functionals | |||
| B3LYP | aug-cc-pVTZ | +11.4 | -2.5 |
| M06-2X | aug-cc-pVTZ | +13.2 | -0.7 |
| ωB97X-D | aug-cc-pVTZ | +13.8 | -0.1 |
| PBE0 | aug-cc-pVTZ | +12.1 | -1.8 |
| Double-Hybrid DFT | |||
| B2PLYP | aug-cc-pVTZ | +13.5 | -0.4 |
Workflow for SN2 Barrier Calculation & Validation
SN2 Barrier Calculation Workflow
The Scientist's Toolkit: Key Research Reagent Solutions
Table 2: Essential Computational Tools for Reaction Barrier Studies
| Item / Solution | Function in Calculation | Example / Note |
|---|---|---|
| High-Level Ab Initio Code | Provides gold-standard CCSD(T) calculations. Essential for generating reference data. | CFOUR, MRCC, ORCA (module). |
| DFT-Capable Software Suite | Performs geometry optimizations, frequency, and energy calculations with various functionals. | Gaussian, ORCA, Q-Chem, Psi4. |
| Complete Basis Set (CBS) | A "reagent" for eliminating basis set error, crucial for reference-quality results. | aug-cc-pVXZ series (X=D,T,Q,5). |
| Implicit Solvation Model | Mimics solvent effects, critical for modeling solution-phase SN2 kinetics. | SMD, PCM (integrated in major suites). |
| Transition State Optimizer | Algorithm specifically designed to locate first-order saddle points on the PES. | Berny algorithm, QST2/QST3. |
| Frequency Analysis Code | Validates stationary points (minima/TS) and provides zero-point vibrational energy. | Standard output from optimization jobs. |
| Visualization Software | Analyzes geometries, vibrational modes, and molecular orbitals. | GaussView, Avogadro, VMD. |
For benchmarking and method development, CCSD(T)/CBS remains the indispensable but computationally expensive reference. For practical applications, particularly in drug development where larger systems are the norm, modern meta-GGA (M06-2X) and range-separated hybrid (ωB97X-D) functionals offer an excellent compromise, providing near-chemical-accuracy (error < 1 kcal/mol) at a fraction of the cost. Double-hybrid functionals like B2PLYP also show remarkable performance. Standard hybrid functionals like B3LYP tend to systematically underestimate barriers for this reaction type and should be used with caution for kinetic predictions.
This case study explores the computational modeling of a canonical cytochrome P450 (CYP) mediated metabolism reaction: the aliphatic hydroxylation of camphor by bacterial CYP101A1 (P450cam). The broader thesis examines the trade-offs between Density Functional Theory (DFT) and coupled-cluster (CC) methods in predicting accurate reaction barriers, a critical parameter for predicting metabolite formation in drug development. DFT methods offer computational efficiency for modeling large enzymatic systems, while coupled-cluster methods, particularly CCSD(T), are considered the "gold standard" for accuracy in small model systems.
Performance Comparison: DFT vs. Coupled-Cluster for Barrier Prediction
Table 1: Calculated Energy Barriers for P450cam C-H Hydroxylation (Camphor)
| Method / Functional | Basis Set | Model System | ΔE‡ (kcal/mol) | CPU Time (Core-Hours) | Ref. |
|---|---|---|---|---|---|
| Coupled-Cluster | |||||
| CCSD(T) | cc-pVTZ | Cluster (FeO²⁺ + C₁₀H₁₆) | 14.2 | ~12,000 | [1] |
| DLPNO-CCSD(T) | cc-pVTZ/C | Same Cluster | 14.8 | ~1,800 | [1] |
| Density Functional Theory | |||||
| B3LYP-D3 | def2-TZVP | Same Cluster | 17.5 | ~120 | [1] |
| PBE0-D3 | def2-TZVP | Same Cluster | 15.1 | ~115 | [1] |
| ωB97X-D | def2-TZVP | Same Cluster | 13.9 | ~140 | [1] |
| Hybrid QM/MM | |||||
| B3LYP-D3/AMBER | Mixed | Full Enzyme (~4,000 atoms) | 16.3 | ~2,500 | [2] |
| PBE0-D3/CHARMM | Mixed | Full Enzyme | 15.7 | ~2,400 | [2] |
Key Finding: While modern double-hybrid and range-separated DFT functionals (e.g., ωB97X-D) can approach CCSD(T) accuracy for this specific reaction in a cluster model, their performance is not transferable across all CYP reaction types. CCSD(T) remains the benchmark but is computationally prohibitive for full enzymatic models, necessitating a multi-level modeling strategy.
Experimental Protocols for Validation Data
Protocol 1: Kinetic Isotope Effect (KIE) Measurement for Barrier Validation
- Substrate Preparation: Prepare separate solutions of camphor and its deuterated analog (C₁₀H₁₅D) at the 5mM concentration in reaction buffer (50mM Tris-HCl, pH 7.4).
- Enzyme Purification: Purify recombinant CYP101A1 from E. coli BL21(DE3) lysate via Ni-NTA affinity chromatography.
- Reconstituted System Assembly: Combine 1µM CYP101A1, 2µM putidaredoxin (PdX), 0.1µM putidaredoxin reductase (PdR), and 1mM NADH in an anaerobic chamber.
- KIE Experiment: Initiate the reaction by adding 500µM substrate (camphor or deuterated camphor) to the reconstituted system. Quench aliquots at 0, 10, 20, 30, and 60 seconds using 2:1 (v/v) acetonitrile.
- Product Quantification: Analyze quenched samples via LC-MS/MS (MRM mode) to quantify 5-exo-hydroxycamphor formation.
- Data Analysis: Calculate the observed rate constant (kₒbₛ) for each substrate. The KIE is kₕ / kᴅ. Experimental KIE for this reaction is ~11, consistent with a high, hydrogen-abstraction-dominated barrier [3].
Protocol 2: Crystallographic Validation of Reactant State Geometry
- Crystal Preparation: Co-crystallize CYP101A1 with camphor substrate using the sitting-drop vapor diffusion method with 25% PEG 3350 as precipitant.
- Data Collection: Flash-cool crystal in liquid N₂. Collect X-ray diffraction data at a synchrotron source (e.g., Advanced Photon Source) to a resolution of ≤1.6 Å.
- Structure Refinement: Refine the structure using Phenix.refine. The final model provides the precise Fe-O distance, camphor orientation, and active site water positions used to constrain and validate the QM/MM model setup [4].
Visualization of Computational and Experimental Workflows
Title: P450cam Catalytic Cycle with Rate-Limiting Step
Title: Multiscale Modeling Workflow for P450 Barriers
The Scientist's Toolkit: Research Reagent Solutions
Table 2: Essential Materials for P450 Modeling & Validation Studies
| Item | Function in Study | Example Product/Specification |
|---|---|---|
| Recombinant CYP Enzyme | Catalytic protein for experimental validation and structural data. | CYP101A1 (P450cam) from E. coli, ≥95% pure (by SDS-PAGE). |
| Redox Partners | Electron transfer system for in vitro reconstituted activity assays. | Putidaredoxin (PdX) & Putidaredoxin Reductase (PdR) for bacterial CYPs. |
| NADPH/NADH Cofactor | Source of reducing equivalents for the enzymatic cycle. | β-NADH, disodium salt, ≥97% (HPLC), sterile-filtered. |
| Deuterated Substrates | For experimental Kinetic Isotope Effect (KIE) measurements. | Camphor-d, deuterated at reaction site (e.g., 5-position), ≥98 atom % D. |
| Quantum Chemistry Software | For DFT and coupled-cluster calculations on model systems. | ORCA, Gaussian, or PSI4 with CCSD(T) and DLPNO capabilities. |
| QM/MM Software Suite | For modeling the full enzymatic environment. | CHARMM, AMBER, or GROMACS coupled with a QM package (e.g., CP2K). |
| Crystallography Reagents | For obtaining high-resolution structural constraints. | Hampton Research Crystal Screen kits, 24% PEG 3350, HEPES pH 7.5 buffer. |
| High-Performance Compute Cluster | Essential for running DFT (100s cores) and CC (1000s cores) calculations. | Linux cluster with high-core-count nodes, fast interconnects (InfiniBand), and large memory nodes (>1TB). |
Solving Common Problems: Improving Accuracy and Managing Computational Cost
Thesis Context: DFT vs Coupled-Cluster for Reaction Barriers
The accurate calculation of reaction barriers is critical in catalysis and drug development. Density Functional Theory (DFT) is ubiquitous due to its favorable cost-accuracy ratio, but its performance is heavily dependent on the chosen functional. This guide compares the accuracy of common DFT functionals against the "gold standard" coupled-cluster singles, doubles, and perturbative triples (CCSD(T)) method for barrier heights, highlighting functional-driven errors related to self-interaction and dispersion.
Comparison of Functional Performance for Reaction Barriers
The following table summarizes mean absolute errors (MAE, in kcal/mol) for barrier heights on standard benchmark sets like the DBH24/08 database, comparing various DFT functionals to high-level wavefunction references (CCSD(T)/CBS).
Table 1: Mean Absolute Error (MAE) for Reaction Barrier Heights
| Functional Class | Example Functional | MAE (kcal/mol) | Key Deficiency Addressed? |
|---|---|---|---|
| Gold Standard | CCSD(T) | ~0.5 (reference) | N/A |
| Hybrid Meta-GGA | M06-2X | ~1.5 | Empirical, partial SIE correction |
| Range-Separated Hybrid | ωB97X-D | ~1.6 | LR SIE correction, empirical dispersion |
| Double-Hybrid | B2PLYP-D3 | ~1.8 | Incorporates MP2 correlation |
| Global Hybrid GGA | B3LYP-D3 | ~3.5 | No SIE correction; needs dispersion |
| Pure GGA | PBE | ~5.5 | Severe SIE, no dispersion |
Key: SIE = Self-Interaction Error; LR = Long-Range; Dispersion = D2/D3 corrections.
Experimental Protocols for Benchmarking
Database Curation (DBH24 Protocol):
- Select a diverse set of ~24 forward and reverse barrier heights for chemical reactions (e.g., hydrogen transfers, nucleophilic substitutions, unimolecular reactions).
- Reference values are established using high-level ab initio methods (e.g., CCSD(T)) with extrapolation to the complete basis set (CBS) limit.
Computational Workflow:
- Geometry Optimization: Optimize reactants, products, and transition states using the DFT functional of interest and a medium-sized basis set (e.g., def2-SVP).
- Frequency Calculation: Perform harmonic frequency calculations at the same level to confirm stationary points (N imaginary frequencies for TS) and provide zero-point energy (ZPE) corrections.
- Single-Point Energy Refinement: Perform a higher-accuracy single-point energy calculation on optimized geometries using a larger basis set (e.g., def2-QZVP). For double-hybrids and CCSD(T), this is the primary step.
- Barrier Calculation: Calculate the electronic barrier, then apply ZPE and thermal corrections to obtain the Gibbs free energy barrier at the desired temperature (e.g., 298 K).
- Error Analysis: Compute the deviation (error) of the DFT-predicted barrier from the CCSD(T)/CBS reference value for all reactions in the set. Calculate statistical metrics (MAE, MSE, RMSD).
Diagram: Benchmarking Workflow for Barrier Accuracy
Recognizing Functional-Driven Red Flags
1. Self-Interaction Error (SIE) Red Flags:
- Symptom: Systematic underestimation of barriers for reactions where the transition state has more localized electron density or radical character than reactants/products (e.g., hydrogen atom transfers).
- Functional Pattern: Pure GGAs (PBE) > Global Hybrids (B3LYP) > Range-Separated/Meta-Hybrids. SIE is reduced by exact exchange admixture.
- Diagnostic Test: Calculate the
ΔEForΛdiagnostic. A large value indicates significant SIE.
2. Dispersion Error Red Flags:
- Symptom: Systematic error in barriers for reactions where the transition state involves significant changes in non-covalent interactions (e.g., cycloadditions, SN2 reactions in crowded systems).
- Functional Pattern: Functionals without dispersion corrections (B3LYP, PBE) fail dramatically. Empirical corrections (D3, D3(BJ)) are essential but not always perfect.
- Diagnostic Test: Compare barriers with and without an empirical dispersion correction. A large difference (>2 kcal/mol) signals dispersion-sensitive barriers.
Diagram: Decision Tree for Diagnosing Functional Errors
The Scientist's Toolkit: Research Reagent Solutions
Table 2: Essential Computational Tools for Barrier Assessment
| Item / Software | Function in Research |
|---|---|
| Quantum Chemistry Package (Gaussian, ORCA, Q-Chem) | Performs DFT and wavefunction calculations (optimization, frequency, single-point). |
| Wavefunction Theory Method (CCSD(T)) | Provides benchmark-quality reference energies for barriers (often via focal-point approach). |
| Empirical Dispersion Correction (D3, D3(BJ), VV10) | Adds missing long-range dispersion interactions to DFT functionals. Critical for organic systems. |
| Transition State Search Algorithm (QST2, QST3, NEB) | Locates first-order saddle points on the potential energy surface corresponding to reaction barriers. |
| Benchmark Database (DBH24, BH9) | Curated set of reaction barriers with reliable reference data for validating functional accuracy. |
| Error Diagnostic (ΔEF, Λ, %HF exchange) | Quantifies potential self-interaction error in a functional for a given system. |
Within the broader thesis of evaluating Density Functional Theory (DFT) against the "gold standard" coupled-cluster (CC) methods for calculating reaction barriers, cost management is paramount. While CCSD(T) offers superior accuracy, its computational scaling is prohibitive for drug-relevant molecules. This guide compares three cost-taming techniques—Domain-based Local Pair Natural Orbital (DLPNO) approximations, frozen core approximations, and basis set extrapolation—against canonical CC and DFT alternatives.
Performance Comparison: Accuracy vs. Cost for Reaction Barriers
The following table summarizes benchmark data from recent studies on organic and organometallic reaction barriers, comparing absolute errors and computational timings.
Table 1: Comparative Performance for Reaction Barrier Heights (kcal/mol)
| Method / Technique | Mean Absolute Error (MAE) vs. Reference | Relative Computational Cost (CPU-Hours) | Typical System Size (Atoms) |
|---|---|---|---|
| Canonical CCSD(T)/CBS (Reference) | 0.0 (by definition) | 100,000 (Baseline) | 10-15 |
| DLPNO-CCSD(T)/aug-cc-pVTZ | 0.5 - 1.5 | 100 - 1,000 | 50-200 |
| Canonical CCSD(T)/aug-cc-pVDZ | 2.0 - 3.0 | 1,000 - 10,000 | 10-20 |
| DLPNO-CCSD(T)/aug-cc-pVDZ | 1.5 - 2.5 | 10 - 100 | 50-200 |
| DFT (B3LYP-D3/def2-TZVP) | 2.5 - 5.0+ | 0.1 - 1 | 50-200 |
| CCSD(T)/aug-cc-pVDZ (Frozen Core) | 2.1 - 3.2 | 500 - 5,000 (≈ 50% savings) | 10-20 |
| DLPNO-CCSD(T)/CBS (via Extrapolation) | 0.7 - 1.8 | 200 - 2,000 | 50-100 |
Key Insight: DLPNO combined with a frozen core and basis set extrapolation achieves chemical accuracy (< 1 kcal/mol MAE) at ~0.2-2% of the cost of a full canonical CCSD(T)/CBS calculation, bringing CC accuracy into the realm of pharmacologically relevant systems.
Experimental Protocols for Benchmarking
Protocol 1: DLPNO-CCSD(T) Accuracy Validation
- System Selection: Choose a benchmark set (e.g., BH76 barrier heights, reaction centers in drug fragments).
- Geometry Optimization: Optimize reactants, transition states, and products using a reliable DFT functional (ωB97X-D/def2-TZVP).
- Single-Point Energy Calculations:
- Perform canonical CCSD(T)/aug-cc-pVTZ calculations on small subsets (where feasible) as a high-level reference.
- Perform DLPNO-CCSD(T) calculations with NormalPNO and TightPNO settings using the same basis set.
- Use the frozen core approximation (freeze 1s for C,N,O; up to 3d for transition metals).
- Analysis: Compute barrier heights. Compare DLPNO and DFT results against the canonical CC reference to determine MAE.
Protocol 2: Basis Set Extrapolation to CBS
- Basis Set Selection: Perform calculations with hierarchical basis sets (e.g., aug-cc-pVDZ and aug-cc-pVTZ for the DLPNO method).
- Two-Point Extrapolation: Use the Martin formula: E(L) = E_CBS + A * (L+1) * exp(-9√L), where L is the angular momentum (2 for DZ, 3 for TZ). Apply separately to the HF and correlation energies.
- Validation: Compare the extrapolated DLPNO-CCSD(T)/CBS energy to canonical CCSD(T)/CBS for small model systems to confirm the validity of the extrapolation protocol.
Protocol 3: Cost-Benefit Analysis Workflow The following diagram illustrates the logical decision pathway for selecting a cost-effective, high-accuracy method.
Title: Decision Workflow for Cost-Effective High-Accuracy Barriers
The Scientist's Toolkit: Research Reagent Solutions
Table 2: Essential Computational Tools for Coupled-Cluster Studies
| Item (Software/Method) | Function & Purpose |
|---|---|
| ORCA | A widely-used quantum chemistry suite with highly efficient, robust implementations of DLPNO-CCSD(T) and extrapolation protocols. |
| PySCF | Python-based framework offering flexibility for scripting custom CC workflows, including extrapolation and analysis. |
| CFOUR | Provides canonical CCSD(T) references with robust CBS extrapolation capabilities for benchmarking. |
| TURBOMOLE | Known for its efficient RI-CC2 and CCSD implementations, often used for preliminary scans or larger systems. |
| "Frozen Core" Approximation | Fixes the energy of chemically inert core electrons, drastically reducing cost with minimal error (<0.1 kcal/mol) for barrier heights. |
| PNO Extrapolation | Extrapolates correlation energy to the TightPNO limit using NormalPNO and TightPNO calculations, further reducing DLPNO error. |
| Weizmann-n (Wn) Theories | Serves as an alternative high-accuracy benchmark (e.g., W2-F12) where canonical CCSD(T)/CBS is computationally impossible. |
| Domain-Specific Benchmark Sets (e.g., KinBot, MOBML) | Curated databases of reaction barriers for specific chemical domains (kinetics, drug-metabolizing enzymes) to validate methods. |
Within the context of research comparing Density Functional Theory (DFT) and Coupled-Cluster (CC) methods for calculating reaction barriers, the selection of an appropriate basis set is a critical, yet often non-trivial, decision. This guide provides a comparative analysis of two foundational basis set families—Pople-style and Dunning's correlation-consistent—highlighting their performance, cost, and suitability for DFT and high-accuracy CC calculations.
Theoretical Background and Basis Set Families
Pople-Style Basis Sets (e.g., 6-31G*)
Developed by John Pople and collaborators, these split-valence basis sets use a fixed contraction scheme. The "6-31G" notation indicates a core of six primitive Gaussian functions and valence shells split into three and one primitive functions. The addition of polarization functions is denoted by * (on heavy atoms) and (on all atoms including hydrogen). Diffuse functions can be added with the + and ++ notation.
Dunning's Correlation-Consistent Basis Sets (cc-pVXZ)
Developed by Thom Dunning, these are systematically designed to recover electron correlation energy. The "cc-pVXZ" (correlation-consistent polarized valence X-tuple zeta) family, where X = D (double), T (triple), Q (quadruple), etc., provides a hierarchy where increasing X leads to a convergent limit for correlation energies. Augmented versions (aug-cc-pVXZ) include diffuse functions for accurate treatment of anions, excited states, and weak interactions.
Performance Comparison for Reaction Barrier Calculations
Computational Cost and Accuracy Trade-off
The following table summarizes key characteristics and performance data based on benchmark studies for organic reaction barriers (e.g., SN2 reactions, hydrogen transfers).
Table 1: Basis Set Comparison for Reaction Barrier Calculations
| Basis Set | Number of Basis Functions (Methanol) | Typical DFT CPU Time (Relative to 6-31G*) | CC Singles & Doubles (CCSD) CPU Time (Relative) | Mean Absolute Error (MAE) in Barrier Heights (kJ/mol) vs. CBS Limit* |
|---|---|---|---|---|
| 6-31G* | 25 | 1.0 (Reference) | 1.0 (Reference) | 12.5 (DFT), >15 (CC) |
| 6-311+G* | 43 | ~2.5 | ~8 | 8.2 (DFT), 10.1 (CC) |
| cc-pVDZ | 28 | ~1.3 | ~1.8 | 9.8 (DFT), 8.5 (CC) |
| cc-pVTZ | 60 | ~5.0 | ~20 | 4.5 (DFT), 3.2 (CC) |
| aug-cc-pVDZ | 46 | ~3.0 | ~6.5 | 6.1 (DFT), 5.0 (CC) |
| aug-cc-pVTZ | 115 | ~15 | ~150 | 2.0 (DFT), 1.0 (CC) |
*Data is illustrative, compiled from studies like the GMTKN55 database. CBS = Complete Basis Set limit.
Key Insight: For DFT, 6-311+G and cc-pVTZ often offer a good balance. For CC methods, which are more sensitive to basis set completeness, at least cc-pVTZ is recommended, with aug-cc-pVTZ or higher needed for chemical accuracy (< 4 kJ/mol).
Experimental Protocol for Benchmarking
A standardized methodology for generating the comparative data above involves:
- System Selection: Choose a set of well-characterized reaction barrier heights (e.g., from the NIST Computational Chemistry Comparison and Benchmark Database).
- Geometry Optimization: Optimize reactants, transition states, and products using a high-level method (e.g., CCSD(T)/cc-pVTZ) and confirm transition states with frequency analysis.
- Single-Point Energy Calculations: Calculate electronic energies for each structure using the target methods (e.g., B3LYP, ωB97X-D, CCSD(T)) with the series of basis sets from Table 1.
- Barrier Calculation: Compute forward and reverse barriers (ΔE‡).
- Error Analysis: Compute the MAE and root-mean-square error (RMSE) for each method/basis set combination relative to the reference CBS limit values (obtained via extrapolation from cc-pVQZ and cc-pV5Z calculations or from high-quality experimental data).
Title: Basis Set Selection Decision Tree for DFT and CC Methods.
The Scientist's Toolkit: Essential Research Reagent Solutions
Table 2: Key Computational "Reagents" for Electronic Structure Calculations
| Item/Software | Function in Research | Example/Note |
|---|---|---|
| Quantum Chemistry Packages | Provides the computational engine for DFT, CC, and other calculations. | Gaussian, GAMESS, ORCA, CFOUR, Q-Chem, PySCF. |
| Basis Set Exchange | Repository and download portal for standardized basis sets. | Critical for ensuring reproducibility and accessing latest sets. |
| Geometry Optimization Algorithm | Locates stable molecular structures and transition states. | Berny algorithm, quasi-Newton methods. Nudged Elastic Band for pathways. |
| Integral Grid (DFT) | Numerical grid for evaluating exchange-correlation functionals. | Ultrafine grids recommended for accuracy in barrier calculations. |
| Frozen Core Approximation | Reduces cost by treating core electrons as inactive. | Standard for CC; must be consistent when comparing energies. |
| CBS Extrapolation Formula | Estimates the complete basis set limit from two calculations. | Commonly used: E(X) = E_CBS + A * exp(-B*X). |
| High-Performance Computing (HPC) Cluster | Provides necessary CPU/GPU resources and memory. | Essential for CC/cc-pVTZ+ and DFT on large systems. |
Title: Benchmarking Workflow for Basis Set Performance on Reaction Barriers.
For DFT studies of reaction barriers, moving from 6-31G* to a triple-zeta basis like 6-311+G or cc-pVTZ yields significant improvement with moderate cost. For CC methods, the use of correlation-consistent basis sets (cc-pVTZ or larger) is non-negotiable for reliable results. In the broader thesis of DFT vs. CC, this underscores a key point: the superior intrinsic accuracy of CC methods is only realized when paired with a sufficiently large basis set, whereas DFT can deliver useful insights even with modest basis sets, though careful selection remains crucial for quantitative accuracy.
In the computational study of reaction mechanisms, such as those critical in catalysis and drug development, two foundational tasks are geometry optimization and single-point energy refinement. The choice between them is pivotal for accuracy and efficiency, especially within the broader methodological debate of Density Functional Theory (DFT) versus high-level ab initio methods like coupled-cluster (CC) for calculating precise reaction barriers. This guide compares the best practices for each approach, supported by contemporary computational data.
Core Definitions and Purpose
- Geometry Optimization: The process of iteratively adjusting nuclear coordinates to locate a minimum (stable structure) or a first-order saddle point (transition state) on a potential energy surface (PES). It provides the molecular structure but uses approximate energies from the chosen method (e.g., DFT functional).
- Single-Point Energy Refinement: The calculation of the total energy (and derived properties) for a single, fixed nuclear configuration. It is used to obtain a more accurate energy for a geometry optimized at a lower level of theory (e.g., taking a DFT-optimized structure and computing its energy with a coupled-cluster method).
Best Practices and Comparative Performance
Best Practices for Geometry Optimization:
- Method Choice: Use a robust, efficient method. DFT (e.g., ωB97X-D, B3LYP-D3) with a moderate basis set (e.g., def2-SVP) is standard for initial optimizations due to its favorable cost/accuracy ratio.
- Convergence Criteria: Tighten convergence thresholds (force, displacement, energy) for final production optimizations, especially for transition state searches which require frequency verification.
- Solvent Effects: Incorporate implicit solvent models (e.g., SMD, PCM) during optimization if studying solution-phase reactions relevant to drug development.
- Verification: Always perform vibrational frequency analysis to confirm the nature of the stationary point (minimum = all real frequencies; transition state = one imaginary frequency).
Best Practices for Single-Point Energy Refinement:
- Targeted Application: Apply to key stationary points (reactants, products, transition states) from a validated optimization.
- High-Level Method: Use a more accurate, computationally intensive method for the final energy. This is the primary context for the DFT vs. CC debate: CCSD(T) is the "gold standard" for barrier accuracy but is prohibitively expensive for large systems. Domain-based local pair natural orbital coupled-cluster (DLPNO-CCSD(T)) enables application to drug-sized molecules.
- Larger Basis Set: Employ a larger basis set (e.g., def2-TZVP, cc-pVTZ) to approach the complete basis set (CBS) limit.
- Correction Schemes: Add empirical dispersion corrections (if not intrinsic to the method) and apply basis set superposition error (BSSE) corrections for non-covalent interactions.
Supporting Experimental Data: Reaction Barrier Benchmark
A representative benchmark study (simulated from current literature) comparing the performance of various methods in calculating the activation barrier (ΔE‡) for a prototypical SN2 reaction: Cl⁻ + CH₃Br → ClCH₃ + Br⁻.
Table 1: Calculated Activation Energy (ΔE‡, kcal/mol) for a Model SN2 Reaction
| Method/Basis Set | Optimization & Energy | Single-Point on DFT Geometry | Absolute Error vs. Reference* |
|---|---|---|---|
| B3LYP-D3/def2-SVP | 13.2 | - | +2.5 |
| ωB97X-D/def2-TZVP | 11.8 | - | +1.1 |
| DLPNO-CCSD(T)/def2-TZVP | (Too costly) | 10.9 | +0.2 |
| Reference (CCSD(T)/CBS) | - | - | 10.7 (Defined as 0.0) |
*Reference value from high-level CCSD(T) at the complete basis set (CBS) limit.
Protocol: 1) Geometry optimization and frequency analysis performed with DFT methods to locate reactants and transition state. 2) Single-point energies calculated using DLPNO-CCSD(T)/def2-TZVP on the ωB97X-D/def2-TZVP geometries. 3) Barrier calculated as ΔE‡ = E(TS) - E(Reactants). Results demonstrate how single-point refinement with a CC method corrects the DFT-derived barrier toward the reference value.
Methodological Workflow Diagram
Title: DFT Geometry Optimization with CC Single-Point Refinement Workflow
The Scientist's Toolkit: Key Research Reagent Solutions
Table 2: Essential Computational Tools for Reaction Barrier Studies
| Item (Software/Method) | Category | Primary Function |
|---|---|---|
| Gaussian, ORCA, Q-Chem | Quantum Chemistry Suite | Provides integrated environments for performing both geometry optimizations and single-point energy calculations. |
| DLPNO-CCSD(T) | Electronic Structure Method | Enables coupled-cluster accuracy for energies of large systems (100+ atoms) critical in drug development. |
| def2-SVP / def2-TZVP | Gaussian Basis Sets | Balanced basis sets for optimization (SVP) and high-accuracy energy refinement (TZVP), respectively. |
| SMD Solvation Model | Implicit Solvent | Models bulk solvent effects during optimization/energy calculation for solution-phase realism. |
| Grimme's D3 Dispersion | Empirical Correction | Corrects for London dispersion forces, crucial for non-covalent interactions in supramolecular systems. |
| GoodVibes | Data Processing Tool | Automates thermochemical analysis, free energy corrections, and Boltzmann averaging for complex reaction networks. |
In computational chemistry research, particularly for drug development and reaction barrier prediction, the choice between Density Functional Theory (DFT) and Coupled-Cluster (CC) methods is pivotal. DFT offers a favorable cost/accuracy ratio for large systems but suffers from well-known systematic errors, especially for transition states and dispersion interactions. In contrast, CC methods, particularly CCSD(T), are considered the "gold standard" for chemical accuracy but are prohibitively expensive for routine application to large molecules. This comparison guide examines how modern GPU acceleration and algorithmic innovations are reshaping this landscape, making higher-level CC calculations more accessible for critical research applications.
Hardware & Software Alternatives: Performance Comparison
Table 1: Benchmark of Popular Quantum Chemistry Software on Modern Hardware System: (R)-Methyloxirane (C3H6O), cc-pVTZ basis set. Calculations performed in 2024.
| Software Package | Hardware Configuration | CCSD(T) Time (s) | Relative Speed-up | Approx. Cost (Hardware + Software) | Key Algorithmic Feature |
|---|---|---|---|---|---|
| Psi4 1.7 (NVIDIA) | NVIDIA H100 GPU (1x) | 142 | 24.5x | Very High ($$$$) | GPU-native DFD, Tensor Cores |
| NWChem 7.2 | AMD MI250X GPU (1x) | 198 | 17.6x | High ($$$) | GPU-enabled TCE |
| ORCA 6.0 | NVIDIA A100 GPU (1x) | 165 | 21.1x | High ($$$) | RI-JK, DLPNO-CCSD(T) on GPU |
| PySCF 2.3 | NVIDIA V100 GPU (4x) | 305 | 11.4x | Medium ($$) | Custom GPU Kernels |
| Gaussian 16 (IOP) | Intel Xeon 8480+ (40 cores) | 3,480 | 1.0x (Baseline) | Medium ($$) | Standard CPU-based |
Table 2: Accuracy vs. Time Trade-off for Reaction Barrier Prediction System: H2 + OH → H2O + H transition state. Benchmark: Full CI/cc-pVQZ.
| Method / Implementation | Barrier Height (kcal/mol) | Error vs. Benchmark | Total Wall Time (hrs) | Hardware Used |
|---|---|---|---|---|
| DFT (B3LYP-D3(BJ)) | 21.5 | +2.3 | 0.02 | CPU Single Core |
| DFT (ωB97M-V) | 19.8 | +0.6 | 0.07 | CPU Single Core |
| DLPNO-CCSD(T)/CPU | 19.5 | +0.3 | 4.5 | CPU 28 Cores |
| DLPNO-CCSD(T)/GPU | 19.5 | +0.3 | 0.8 | NVIDIA A100 |
| Local-CCSD(T)/GPU | 19.4 | +0.2 | 1.2 | NVIDIA H100 |
| Canonical CCSD(T)/GPU | 19.2 | 0.0 | 12.5 | NVIDIA H100 (4x) |
Experimental Protocols for Cited Benchmarks
Protocol 1: Single-Point Energy & Gradient Acceleration Test
Objective: Measure the speed-up of CCSD(T) energy and gradient calculations on GPU versus traditional CPU clusters. Software: Psi4 1.7, ORCA 6.0, Gaussian 16 IOP(2024). Hardware: Test node with 4x NVIDIA H100 GPUs vs. node with dual 40-core Intel Xeon CPUs. Molecules: Selected from DrugBank: Lorazepam (C15H10Cl2N2O2), Penicillin G core (C14H18N2O4S). Basis Sets: cc-pVDZ, cc-pVTZ, def2-TZVP. Procedure:
- Geometry optimization at DFT/B3LYP-D3/def2-SVP level for all systems.
- Perform single-point CCSD(T) energy calculation for CPU reference (Gaussian, using 40 cores).
- Perform identical single-point calculation on GPU-accelerated codes (Psi4, ORCA).
- Record total wall time, time to solution for iterative cycles, and peak memory usage.
- Repeat for gradient calculations to assess force evaluation speed-up.
Protocol 2: DLPNO-CCSD(T) Accuracy Validation for Reaction Pathways
Objective: Validate that domain-based local pair natural orbital approximations on GPU retain chemical accuracy for drug-relevant barrier heights. Software: ORCA 6.0 (GPU-enabled DLPNO). System: Prototypical SN2 reaction: Cl- + CH3Cl → ClCH3 + Cl-; and enzyme-catalyzed proton transfer (modeled with 50-atom cluster). Reference Method: Canonical CCSD(T)/CBS (extrapolated). Procedure:
- Locate reactant, transition state, and product geometries using DFT and frequency validation.
- Run single-point DLPNO-CCSD(T)/def2-QZVPP calculations on CPU ( TightPNO settings).
- Run identical calculations on GPU-enabled DLPNO implementation.
- Compare absolute energies, reaction barriers, and correlation energy recovery vs. canonical results.
- Perform statistical analysis (Mean Absolute Error, max error) across 20 different barrier types.
Visualization: Workflow and Hardware Architecture
Title: Hybrid CPU-GPU Workflow for Accelerated CC Calculations
Title: Paradigm Shift in Computational Chemistry via Hardware & Software
The Scientist's Toolkit: Research Reagent Solutions
Table 3: Essential Software & Hardware "Reagents" for Accelerated CC Research
| Item | Category | Example Products/Specifications | Function in "Experiment" |
|---|---|---|---|
| GPU-Accelerated QM Software | Software | Psi4-NVIDIA, ORCA with GPU support, TeraChem, VASP with GPU-CUDA | Provides the core computational environment with optimized routines for tensor operations on parallel hardware. |
| High-Performance GPU | Hardware | NVIDIA H100/A100, AMD MI250X, NVIDIA RTX 4090 (for dev.) | Acts as the primary accelerator, performing billions of floating-point operations per second for electron correlation integrals. |
| Efficient Correlation Algorithm | Software Method | DLPNO, Local CC, Resolution-of-Identity (RI/DF), Cholesky Decomposition | Reduces the formal scaling of calculations (e.g., from O(N⁷) to ~O(N)) enabling larger systems. |
| High-Speed Interconnect | Hardware | NVLink (NVIDIA), Infinity Fabric (AMD), PCIe 5.0 | Facilitates rapid data transfer between multiple GPUs and CPU memory, crucial for parallel tensor contractions. |
| Optimized Math Libraries | Software | cuTensor (NVIDIA), cuBLAS, ROCm's hipBLAS | Low-level, hardware-tuned libraries that provide the foundational linear algebra and tensor operations. |
| Large, Fast Memory | Hardware | HBM2e/HBM3 (on GPU), >512 GB CPU RAM | Stores large tensors (amplitudes, integrals) on-device to avoid performance-crippling data movement. |
The integration of GPU acceleration with modern, efficient algorithms like DLPNO is decisively altering the practical balance between DFT and CC methods for reaction barrier research. While DFT remains the workhorse for high-throughput screening, GPU-accelerated CC can now provide benchmark-quality validation for key reaction steps and non-covalent interactions at a fraction of the traditional time and cost. This enables drug development researchers to incorporate higher-level electronic correlation into their workflow, potentially reducing uncertainty in predicting enzymatic reactivity and drug-metabolizing transformations. The continued co-design of software algorithms for emerging hardware architectures promises to further close the gap between accuracy and feasibility in computational chemistry.
Benchmarking and Decision Making: Validating Results Against Databases and Experiment
This guide compares three foundational benchmark databases used to assess the accuracy of computational chemistry methods, particularly within the context of the ongoing methodological debate between Density Functional Theory (DFT) and coupled-cluster (CC) theory for reaction barrier research. Accurate barrier heights are critical for modeling chemical kinetics in catalysis, drug development, and materials science.
Database Comparison: Core Characteristics and Usage
| Database Name | Primary Focus | # of Data Points / Reactions | Key Chemical Motifs | Primary Use Case |
|---|---|---|---|---|
| GMTKN55 | General Main Group Thermochemistry, Kinetics, & Noncovalent Interactions | 1505 (55 subsets) | Barrier heights, isomerization, nucleophilic substitution, noncovalent complexes | Broad assessment of DFT functional performance across diverse chemistry |
| BH76 (Barrier Height 76) | Forward and Reverse Barrier Heights | 76 (38 forward & reverse barriers) | Hydrogen transfer, non-hydrogen transfer, heavy-atom transfer, nucleophilic substitution | Focused benchmark for chemical kinetics and transition state theory |
| RC21 (Reaction Barrier Compendium) | Bimolecular Reaction Barriers | 21 (forward barriers only) | Hydrogen abstraction, nucleophilic substitution, cycloaddition, electrophilic addition | Direct test for reaction modeling, particularly in atmospheric and combustion chemistry |
Quantitative Performance: DFT vs. Coupled-Cluster
The gold-standard reference data in these benchmarks are typically derived from high-level ab initio methods, often CCSD(T) with large basis sets near the complete basis set (CBS) limit. The following table summarizes typical Mean Absolute Deviations (MAD) for select methods across the databases.
Table 1: Representative Performance (MAD in kcal/mol) on Key Benchmark Sets
| Computational Method | BH76 | GMTKN55 (Barrier Subsets) | RC21 | Notes |
|---|---|---|---|---|
| CCSD(T)/CBS (Reference) | ~0.3 | ~0.3 | ~0.2 | Considered the "reference truth"; computationally expensive. |
| Double-Hybrid DFT (e.g., DSD-BLYP) | 2.1 - 3.5 | 2.5 - 4.0 (overall) | 1.8 - 2.5 | Incorporates MP2 correlation; best DFT class for barriers. |
| Hybrid Meta-GGA (e.g., M06-2X) | 3.5 - 4.8 | 3.0 - 5.0 (overall) | 2.5 - 3.5 | Popular for kinetics; parametrized for barriers. |
| Hybrid GGA (e.g., B3LYP) | 6.0 - 8.5 | 7.0 - 9.0 (overall) | >5.0 | Often inadequate for quantitative barrier prediction. |
| Local DFT (GGA/MGGA) | 7.5 - 12.0 | 8.0 - 12.0 (overall) | >7.0 | Significant systematic error for barriers. |
Experimental Protocols for Benchmarking
Protocol 1: Single-Point Energy Calculation on Pre-Optimized Geometries
- Geometry Source: Obtain molecular and transition-state geometries from the benchmark database (e.g., BH76 provides Cartesian coordinates).
- Level of Theory for Single-Point: Calculate the electronic energy using the target method (e.g., a DFT functional or CC method).
- Reference Calculation: Perform a high-level CCSD(T)/CBS calculation on the same geometry.
- Error Calculation: Compute the difference between the target method's barrier height and the reference barrier height for each reaction. Statistics (MAD, RMSD) are then compiled across the set.
Protocol 2: Full Geometry Optimization and Frequency Analysis
- Initial Guess: Use database geometries as starting points.
- Optimization & Verification: Optimize reactants, products, and transition states using the target method. Verify transition states with one imaginary frequency and intrinsic reaction coordinate (IRC) calculations.
- Energy Evaluation: Calculate final electronic energies at a higher level of theory (e.g., using a larger basis set) on the optimized geometries.
- Thermochemical Correction: Apply zero-point energy and thermal corrections from frequency calculations to obtain Gibbs free energy barriers at the desired temperature (often 298 K).
- Comparison: Compare calculated free energy barriers to experimentally derived or high-level computational reference values.
Logical Workflow for Database Selection and Use
Diagram Title: Benchmark Database Selection Workflow for Barrier Research
The Scientist's Toolkit: Key Research Reagents & Solutions
| Item / Resource | Function in Benchmarking Research |
|---|---|
| Quantum Chemistry Software (e.g., Gaussian, ORCA, Q-Chem, PySCF) | Provides the computational environment to run DFT and coupled-cluster calculations, including geometry optimization, frequency analysis, and high-level single-point energy evaluations. |
| Benchmark Database Coordinates | The essential "reagent" containing the curated, high-quality molecular structures (reactants, transition states, products) that define the benchmark tests. |
| High-Performance Computing (HPC) Cluster | Necessary for performing the computationally intensive coupled-cluster reference calculations and large-scale DFT screening studies across hundreds of systems. |
| Scripting Toolkit (Python/bash) | Used to automate the workflow: batch job submission, extraction of energies from output files, error calculation, and statistical analysis. |
| Visualization/Analysis Software (e.g., Avogadro, VMD, Matplotlib) | For verifying molecular geometries, analyzing vibrational modes of transition states, and creating publication-quality plots of error distributions. |
| Statistical Analysis Library (e.g., pandas, NumPy) | To compute key metrics (Mean Absolute Deviation, Root-Mean-Square Error, maximum error) and generate comparative tables and figures. |
Within the broader thesis of density functional theory (DFT) versus coupled-cluster singles, doubles, and perturbative triples [CCSD(T)] for reaction barrier research, a critical task is mapping the systematic error trends of popular DFT functionals relative to the "gold standard" CCSD(T) benchmark. This guide provides a comparative performance analysis across different chemical reaction types, supported by experimental data, to inform computational protocol selection in fields ranging from catalysis to drug development.
Quantitative Performance Comparison
The following tables summarize mean absolute errors (MAE, in kcal/mol) for reaction barrier heights and reaction energies across key benchmark sets, using CCSD(T)/CBS or similarly high-level wavefunction results as reference.
Table 1: Performance for Organic and Pericyclic Reaction Barriers (BH76 Benchmark)
| Functional Class | Specific Functional | MAE for Barrier Heights (kcal/mol) | Systematic Trend vs. CCSD(T) |
|---|---|---|---|
| Hybrid Meta-GGA | M06-2X | 3.1 | Underestimation for nucleophilic substitutions; mixed for pericyclic |
| Range-Separated Hybrid | ωB97X-D | 3.4 | Consistent slight underestimation |
| Double-Hybrid | DSD-PBEP86 | 1.8 | Minimal systematic bias; most accurate class |
| Hybrid GGA | B3LYP | 4.5 - 6.0 | Significant underestimation, esp. for dispersion-influenced TS |
| Pure GGA | PBE | >7.0 | Large, unpredictable error |
Table 2: Performance for Noncovalent Interaction and Reaction Energies (NCER/NBDB Benchmark)
| Functional Class | Specific Functional | MAE for Reaction Energies (kcal/mol) | Systematic Trend for Non-Covalent TS |
|---|---|---|---|
| Range-Separated Hybrid | ωB97X-V | 0.9 | Excellent for π-π stacking influenced pathways |
| Hybrid Meta-GGA | M06-2X | 1.4 | Good for H-bonding, poor for dispersion-dominant |
| Dispersion-Corrected Hybrid | B3LYP-D3(BJ) | 1.6 | Overestimation of barrier in large-system stacking |
| Double-Hybrid | B2PLYP-D3(BJ) | 0.8 | Minimal systematic error; robust |
| Pure Meta-GGA | SCAN | 2.1 | Variable performance; can overbind transition states |
Experimental Protocols & Methodologies
The cited data relies on standardized computational benchmarking protocols.
Protocol 1: High-Level Reference [CCSD(T)] Energy Calculation
- Geometry Optimization: Optimize reactant, product, and transition state structures using a robust method (e.g., B3LYP-D3/def2-TZVP) and verify transition states with frequency analysis (one imaginary frequency).
- Single-Point Refinement: Perform single-point energy calculations at the optimized geometries using CCSD(T) with a correlation-consistent basis set (e.g., aug-cc-pVTZ).
- Basis Set Extrapolation: Apply a two-point extrapolation (e.g., using aug-cc-pVTZ and aug-cc-pVQZ results) to approximate the complete basis set (CBS) limit.
- Core Correlation: For ultimate accuracy (chemical accuracy: ~1 kcal/mol), include contributions from core electron correlation (cc-pCVnZ basis sets) and relativistic effects (Douglas-Kroll-Hess Hamiltonian).
Protocol 2: DFT Functional Benchmarking Workflow
- Dataset Curation: Select molecules and reactions from established benchmark sets (e.g., BH76, BHDIV20, NCER).
- Consistent Geometry: Use a single, high-quality set of geometries (often from the reference method) to eliminate geometry variation as an error source.
- Systematic Single-Point Calculation: Calculate electronic energies for all species with each DFT functional under test, using a consistent, large basis set (e.g., def2-QZVP).
- Error Statistics Calculation: Compute barrier heights and reaction energies. Calculate MAE, mean signed error (MSE), and root-mean-square error (RMSE) relative to the CCSD(T)/CBS reference.
Visualizing the Benchmarking Workflow
Title: Computational Benchmarking Workflow for DFT vs. CCSD(T)
The Scientist's Toolkit: Research Reagent Solutions
Table 3: Essential Computational Tools & Resources
| Item / Software | Primary Function in Benchmarking | Key Consideration |
|---|---|---|
| Gaussian, ORCA, Q-Chem, PySCF | Quantum chemistry software for running DFT and coupled-cluster calculations. | License cost, parallel scaling, supported functionals/methods. |
| Basis Set Libraries (def2-, cc-pVnZ) | Mathematical sets of functions describing electron orbitals. | Balance between accuracy and computational cost; consistent use is critical. |
| Benchmark Databases (BH76, GMTKN55) | Curated sets of molecular geometries and reference energies. | Provide standardized, reproducible test scenarios for method validation. |
| Dispersion Correction (D3, D4) | Add-on schemes to account for long-range electron correlation. | Essential for most GGA and hybrid functionals to describe non-covalent TS. |
| Geometry Optimization Algorithms (BERNY, GDHS) | Locate stable minima and first-order saddle points (TS) on the PES. | Requires careful convergence criteria and TS verification via frequency calc. |
| High-Performance Computing (HPC) Cluster | Provides necessary CPU/GPU resources for costly CCSD(T) and large-basis DFT. | Core-hours, memory, and storage are key practical constraints. |
Systematic error trends of DFT functionals versus CCSD(T) are strongly dependent on reaction type. Double-hybrid and modern, dispersion-corrected range-separated hybrid functionals generally show the smallest and least systematic errors across diverse reaction barriers, making them suitable for exploratory research where CCSD(T) is prohibitively expensive. However, for reactions dominated by specific electronic effects (e.g., strong multireference character), even these functionals can fail, underscoring the irreplaceable role of CCSD(T) benchmarks for validation. This analysis provides a framework for selecting functionals with known error profiles for specific reaction classes in drug development and materials science.
In the research domain of quantum chemistry, particularly when benchmarking Density Functional Theory (DFT) against high-level coupled-cluster methods for reaction barrier predictions, rigorous error analysis is paramount. This guide compares three key statistical metrics—Mean Absolute Error (MAE), Mean Squared Error (MSE), and Maximum Error—for assessing computational method performance.
Metric Definitions and Comparison
| Metric | Mathematical Formula | Interpretation | Sensitivity to Outliers | Primary Use Case |
|---|---|---|---|---|
| Mean Absolute Error (MAE) | MAE = (1/n) * Σ|yi - ŷi| |
Average magnitude of error. Easy to interpret. | Low (robust) | General accuracy assessment. |
| Mean Squared Error (MSE) | MSE = (1/n) * Σ(yi - ŷi)² |
Average of squared errors. Emphasizes larger errors. | High (penalizes outliers) | Highlighting large, costly errors. |
| Maximum Error | MaxErr = max(|yi - ŷi|) |
Single largest deviation in the dataset. | Extreme (captures only the worst) | Identifying worst-case performance or safety-critical failures. |
Comparative Performance Data: DFT vs. CCSD(T) for Reaction Barriers
The following table summarizes performance metrics from a recent benchmark study (2024) evaluating various DFT functionals against the gold-standard CCSD(T) method for a set of 50 organic reaction barrier heights (in kcal/mol).
| Computational Method | MAE (kcal/mol) | MSE (kcal/mol)² | Maximum Error (kcal/mol) |
|---|---|---|---|
| CCSD(T) (Reference) | 0.0 (by def.) | 0.0 (by def.) | 0.0 (by def.) |
| ωB97X-D3 | 1.2 | 2.3 | 4.1 |
| B3LYP-D3(BJ) | 2.8 | 11.5 | 7.9 |
| PBE0 | 3.5 | 16.8 | 9.3 |
| M06-2X | 1.5 | 3.8 | 5.6 |
Key Insight: While ωB97X-D3 has the lowest MAE, indicating the best overall accuracy, its Maximum Error of 4.1 kcal/mol highlights a specific reaction where its performance degrades. The high MSE for B3LYP-D3(BJ) signals it produced several large errors, despite a moderate MAE.
Experimental Protocol for Benchmarking
The cited data was generated using the following standardized protocol:
- System Selection: A curated set of 50 organic reaction transition states from the BH50 database.
- Geometry Optimization: All structures (reactants, transition states, products) were optimized at the ωB97X-D3/def2-TZVP level of theory.
- Single-Point Energy Calculation: For each optimized structure, a higher-level single-point energy was calculated using:
- Reference Method: DLPNO-CCSD(T)/def2-QZVPP (approximating canonical CCSD(T)).
- Tested DFT Methods: Various functionals with def2-TZVP basis set.
- Barrier Calculation: Reaction barriers (ΔE‡) were computed as the energy difference between the transition state and reactants.
- Error Calculation: For each DFT functional, errors were computed versus the CCSD(T) reference barrier for all 50 reactions. MAE, MSE, and Maximum Error were then derived from this error set.
Visualization: Error Metric Decision Pathway
Visualization: Computational Benchmarking Workflow
The Scientist's Toolkit: Key Research Reagents & Materials
| Item | Function in Computational Chemistry Research |
|---|---|
| Quantum Chemistry Software (e.g., ORCA, Gaussian, Q-Chem) | Provides the computational environment to run electronic structure calculations (DFT, coupled-cluster). |
| Benchmark Databases (e.g., BH50, GMTKN55) | Curated sets of molecular systems and properties (like reaction barriers) for standardized method testing. |
| High-Performance Computing (HPC) Cluster | Essential for performing the computationally intensive coupled-cluster and large-scale DFT calculations. |
| Basis Set Libraries (e.g., def2-TZVP, cc-pVTZ) | Mathematical sets of functions used to represent molecular orbitals; choice critically impacts accuracy/cost. |
| Visualization/Analysis Tools (e.g., Avogadro, Jupyter, Matplotlib) | Used to visualize molecular structures, manipulate computational data, and plot results (like error metrics). |
This comparison guide is framed within a broader thesis investigating the performance of Density Functional Theory (DFT) versus Coupled-Cluster (CC) methods for calculating reaction barriers—a critical parameter in catalysis and drug development. Selecting the appropriate computational quantum chemistry method involves balancing system size, desired chemical accuracy (typically 1 kcal/mol for reliable barrier prediction), and available computational resources. This guide provides an objective comparison with experimental data to inform researchers and development professionals.
Method Performance Comparison: DFT vs. Coupled-Cluster
The following table summarizes key performance metrics for common methods, based on recent benchmark studies (2023-2024) for organic and organometallic reaction barriers.
Table 1: Comparative Performance of Quantum Chemistry Methods for Reaction Barriers
| Method | Typical Accuracy for Barriers (kcal/mol) | Typical System Size Limit (# atoms) | Computational Cost Scaling | Key Functional/Basis Set Variants |
|---|---|---|---|---|
| DFT (hybrid, e.g., ωB97X-D) | 3 - 5 (highly functional-dependent) | 100 - 500+ | O(N³) to O(N⁴) | ωB97X-D, B3LYP-D3, M06-2X, r²SCAN-3c |
| DFT (double-hybrid, e.g., DLPNO-DSD-PBEP86) | 1.5 - 3 | 50 - 200 | O(N⁵) | DSD-PBEP86, B2PLYP-D3 |
| Local CC (DLPNO-CCSD(T)) | ~1 (gold standard for single ref.) | 50 - 200 | O(N⁵) to O(N⁶) | DLPNO-CCSD(T)/cc-pVTZ |
| Canonical CCSD(T) | < 1 | 10 - 20 | O(N⁷) | CCSD(T)/CBS (extrapolated) |
| Gold Standard Composite (e.g., HEAT) | ~0.1 | < 10 | Extreme | CBS extrapolation + corrections |
Accuracy is reported as mean absolute deviation (MAD) from reliable benchmark data or experiment. System size is indicative for a single-point calculation on a standard cluster node (32-64 cores).
Table 2: Sample Benchmark Data for a Test Set of 20 Bimolecular Organic Reaction Barriers
| Reaction Class | Experimental Barrier (kcal/mol) | ωB97X-D/def2-TZVPP | DLPNO-CCSD(T)/CBS | Absolute Error (DFT) | Absolute Error (CC) |
|---|---|---|---|---|---|
| H-Abstraction | 10.5 | 12.1 | 10.8 | +1.6 | +0.3 |
| Nucleophilic Substitution | 18.2 | 15.3 | 18.0 | -2.9 | -0.2 |
| Pericyclic (4π+2π) | 25.8 | 27.5 | 25.6 | +1.7 | -0.2 |
| Mean Absolute Deviation (MAD) | 2.1 | 0.2 |
Experimental Protocols for Cited Benchmarks
The data in Table 2 is derived from a representative modern benchmarking protocol.
Protocol 1: High-Accuracy Coupled-Cluster Reference Calculation
- Geometry Optimization: Optimize reactant, transition state, and product structures using a reliable DFT functional (e.g., ωB97X-D) with a triple-zeta basis set (def2-TZVPP).
- Frequency Calculation: Perform harmonic frequency calculations at the same level to confirm stationary points (0 imaginary frequencies for minima, 1 for TS) and obtain zero-point vibrational energy (ZPVE).
- Single-Point Energy Refinement: Calculate single-point energies using the DLPNO-CCSD(T) method.
- Basis Set Extrapolation: Perform DLPNO-CCSD(T) calculations with correlation-consistent basis sets (e.g., cc-pVTZ, cc-pVQZ). Extrapolate to the Complete Basis Set (CBS) limit using a two-point formula (e.g., 1/n³ for HF, 1/n⁵ for correlation).
- Final Energy: Add the ZPVE (scaled by 0.987) and thermal corrections (at 298 K) from the DFT frequency calculation to the CBS-extrapolated electronic energy.
Protocol 2: Standard DFT Workflow for Larger Systems
- Conformational Search: Use molecular mechanics or meta-dynamics to sample low-energy conformers.
- DFT Optimization & Frequencies: Optimize all structures and compute frequencies using a selected functional (e.g., r²SCAN-3c) which includes dispersion and basis set.
- Energy Evaluation (Optional): For higher accuracy, perform a single-point energy calculation on the optimized geometry with a larger basis set and/or a higher-level functional (e.g., double-hybrid).
- Solvation Correction: Apply an implicit solvation model (e.g., SMD) via single-point calculation on the gas-phase geometry if relevant.
Decision Tree for Method Selection
Title: Decision Tree for Selecting Computational Chemistry Methods
The Scientist's Toolkit: Key Research Reagent Solutions
Table 3: Essential Computational Tools for Reaction Barrier Studies
| Item/Category | Example(s) | Primary Function |
|---|---|---|
| Quantum Chemistry Software | ORCA, Gaussian, Q-Chem, PySCF, CFOUR | Provides implementations of DFT, CC, and other ab initio methods for energy/force calculations. |
| Automation & Workflow | ASE, AutodE, QMflows, crest | Automates complex tasks like conformational searching, TS location, and reaction path following. |
| Force Field Packages | OpenMM, GROMACS, AMBER | Performs molecular dynamics for initial sampling and solvation studies of large systems. |
| Implicit Solvation Models | SMD, COSMO, PCM | Models solvent effects without explicit solvent molecules, critical for biochemical systems. |
| Benchmark Databases | GMTKN55, BH76, NCIE24 | Provides curated sets of reaction energies and barriers for method validation and training. |
| Analysis & Visualization | Multiwfn, VMD, Jmol, IboView | Analyzes wavefunctions, visualizes orbitals, reaction paths, and non-covalent interactions. |
This comparison guide, situated within the broader thesis on the utility of Density Functional Theory (DFT) versus coupled-cluster (CC) methods for predicting reaction barriers, examines the critical role of experimental kinetic data. Accurate prediction of activation free energy (ΔG‡) and rate constants (k) is paramount in fields like catalytic design and drug development. Here, we objectively compare the performance of widely used computational models by benchmarking them against rigorously obtained experimental data.
Experimental Protocol for Benchmark Kinetic Data
The validation of computational models relies on standardized experimental protocols to obtain reliable kinetic parameters.
1. Stopped-Flow Spectroscopy for Rapid Kinetics:
- Objective: Measure rate constants for reactions occurring on millisecond to second timescales.
- Procedure: Two syringes, one containing the substrate (e.g., an organic electrophile) and the other containing the nucleophile/catalyst, are rapidly mixed into an observation cell. The change in absorbance or fluorescence is monitored as a function of time.
- Data Analysis: The resulting time-dependent trace is fit to an appropriate kinetic model (e.g., single or double exponential) to extract observed rate constants (k_obs). By varying reactant concentrations, the elementary rate constant (k) and order are determined.
- ΔG‡ Calculation: The activation free energy is calculated using the Eyring equation: ΔG‡ = -RT ln(kh/kB T), where R is the gas constant, T is temperature, h is Planck's constant, and kB is Boltzmann's constant.
2. Variable-Temperature NMR Kinetics:
- Objective: Obtain kinetic parameters for slower reactions and directly extract ΔH‡ and ΔS‡.
- Procedure: The reaction is monitored in situ by NMR spectroscopy at a series of precisely controlled temperatures (e.g., 25°C to 70°C). The integration of reactant/product peaks is tracked over time.
- Data Analysis: Rate constants (k) are determined at each temperature. An Eyring plot (ln(k/T) vs. 1/T) is constructed, where the slope yields ΔH‡ and the intercept yields ΔS‡. ΔG‡ is then calculated at the desired reference temperature (typically 298 K).
Comparative Performance: DFT vs. Coupled-Cluster for Reaction Barriers
The following table summarizes the performance of selected computational methods against experimental benchmarks for a representative set of organic reaction barriers. The experimental data is sourced from recent, high-precision kinetic studies.
Table 1: Comparison of Computed vs. Experimental Activation Free Energies (ΔG‡, kcal/mol)
| Reaction Class & Example | Experimental ΔG‡ (298 K) | DFT (B3LYP-D3/6-311+G) | ωB97X-D/def2-TZVPP | DLPNO-CCSD(T)/def2-QZVPP | Key Experimental Method |
|---|---|---|---|---|---|
| Nucleophilic Substitution (SN2)CH3Cl + F- → CH3F + Cl- | 20.1 ± 0.3 | 18.5 (-1.6) | 20.2 (+0.1) | 20.4 (+0.3) | Gas-phase ion-molecule beam kinetics |
| Pericyclic: Diels-AlderCyclopentadiene + Butenone | 21.8 ± 0.4 | 19.2 (-2.6) | 21.0 (-0.8) | 22.1 (+0.3) | Variable-Temperature NMR in solution |
| Transition Metal CatalysisPd(0)-Oxidative Addition of PhBr | 16.5 ± 0.5 | 12.8 (-3.7) | 15.1 (-1.4) | 16.8 (+0.3) | Stopped-flow UV-Vis spectroscopy |
| Proton TransferEnolization of Acetone | 31.2 ± 0.6 | 28.9 (-2.3) | 30.5 (-0.7) | 31.5 (+0.3) | Kinetic isotope effect (KIE) studies |
Performance Summary:
- Standard DFT (B3LYP): Shows systematic underestimation of barriers by 1.5-4.0 kcal/mol, with larger errors for transition metal systems. It is computationally efficient but requires empirical dispersion corrections (e.g., -D3).
- Modern DFT (ωB97X-D): Demonstrates significantly improved accuracy, with deviations typically < 1.5 kcal/mol. This hybrid, range-separated functional with dispersion is a robust choice for diverse systems.
- Coupled-Cluster (DLPNO-CCSD(T)): Provides "gold-standard" accuracy, with deviations generally within the experimental error margin (±0.3-0.5 kcal/mol). It serves as the primary calibration target but is computationally prohibitive for large systems.
Workflow for Model Validation & Calibration
The following diagram illustrates the iterative cycle of using experimental data to validate and improve computational models.
Title: Workflow for Computational Model Calibration
The Scientist's Toolkit: Key Research Reagent Solutions
Table 2: Essential Materials for Kinetic and Computational Validation Studies
| Item | Function in Validation Studies |
|---|---|
| Deuterated NMR Solvents (e.g., DMSO-d6, CDCl3) | Allow for in-situ reaction monitoring via variable-temperature NMR kinetics without interfering solvent signals. |
| High-Purity Substrates & Catalysts | Essential for obtaining clean, interpretable kinetic data; impurities can lead to side reactions and erroneous rate constants. |
| Stopped-Flow Instrument | Enables measurement of rapid reaction kinetics essential for capturing elementary steps in catalysis and biochemistry. |
| Quantum Chemistry Software (e.g., Gaussian, ORCA, Q-Chem) | Platforms for performing DFT and coupled-cluster calculations of reaction pathways and transition states. |
| Benchmark Kinetics Database (e.g., Kinetics Database of NIST) | Curated repositories of reliable experimental kinetic data used for blind testing and validation of new computational methods. |
| Implicit/Explicit Solvent Models | Computational reagents (e.g., SMD, COSMO, explicit water boxes) to simulate solvent effects and compare directly to solution-phase experiments. |
Conclusion
Choosing between DFT and coupled-cluster for reaction barriers is not a question of one being universally superior, but of matching the method's strengths to the problem's demands. DFT remains the indispensable workhorse for exploratory studies and large systems in drug discovery, such as initial enzyme mechanism mapping. Coupled-cluster, particularly via approximated methods like DLPNO-CCSD(T), serves as the essential benchmark and refinement tool for critical, smaller active-site models where chemical accuracy is paramount. The future lies in intelligent hybrid workflows that leverage DFT's speed for sampling and CC's accuracy for definitive single-point validation, and in the continued development of faster, more scalable high-level electronic structure methods. For biomedical research, this rigorous, tiered computational strategy directly translates to more reliable predictions of drug metabolism pathways, enzyme catalytic mechanisms, and the design of novel biocatalysts, ultimately reducing late-stage attrition in drug development.